💧 A Nation Sinking in Its Own Waste

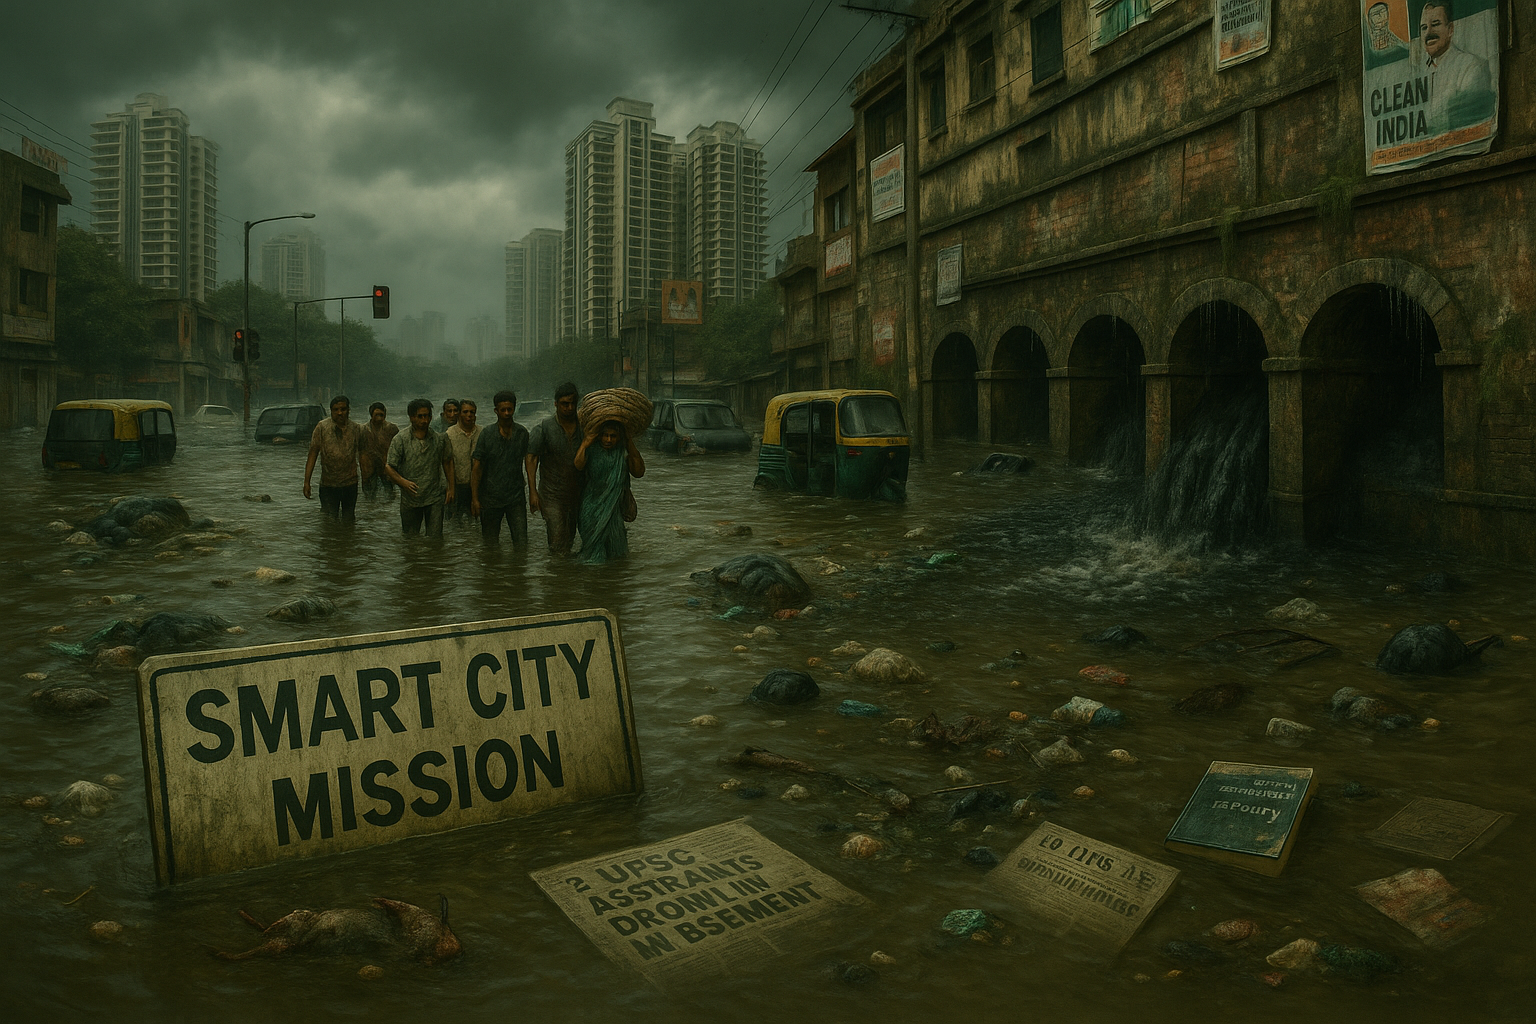
Even after 75 years of independence, over 70% of Indian cities lack basic sewage and garbage disposal systems. Cities with billion-dollar valuations, skyscrapers, and “smart city” tags cannot move water off their streets during rains.

Why? Because India doesn’t just have a drainage crisis—it has a governance catastrophe.

Delhi’s drains, meant for 38 million people, serve only half that number. Bengaluru, which generates 1,800 million litres of sewage daily, treats just 30%. The rest flows into streets and lakes.

Mumbai’s 160-year-old British-era drainage system gasps under 22 million bodies and billions in real estate greed. And when disaster strikes—as it did in Old Rajendra Nagar in July 2024—it kills not just bodies, but dreams.

Three young aspirants, preparing for the civil services, drowned in a flooded basement. The country never noticed.

🌪️ When the System Itself Is the Killer

Let’s be clear: this is not just poor planning—it’s systemic betrayal. Cities have turned rivers into sewage dumps. The Yamuna carries 2.9 billion litres of untreated waste daily.

Mumbai’s Mithi River has been narrowed by over 50% due to slums and encroachments.

Bengaluru’s Vrishabhawathi is now a black river of corporate sewage. Of India’s 603 assessed rivers, 46% are severely polluted, as per a 2025 report.

Floodplains have been devoured by highways, malls, and luxury apartments. Wetlands, nature’s own flood buffers, have been erased.

Since 1990, India has lost 40% of its wetlands. Chennai’s Pallikaranai marsh, once 5,500 hectares, is now a tenth of that, sacrificed for airport expansions. And when the rains come, the water has nowhere to go—except into people’s homes, lungs, and coffins.

💸 The Price of Progress? Blood and Bribes

Corruption is the rot that drowns us. Desilting contracts worth ₹1,500 crore in Mumbai went to shell companies. Delhi’s ₹3,000 crore sewerage plan is stalled, its funds leaking like the city’s pipes.

Bengaluru’s AMRUT scheme met only 20% of its sewage targets—allegedly due to kickbacks and contractor-politician nexuses. The Namami Gange project, with ₹32,000 crore pumped in since 2014, has 68% of its sewage treatment plants non-functional.

While the elite race across global cities, the poor in India wade through filth and disease. In slums, where only 5% have piped water, life is reduced to a slow death.

🚨 Lessons from the World—and from Ourselves

Cities like Tokyo, Singapore, and New York have built systems to capture, clean, and reuse water. India, meanwhile, captures headlines—of avoidable death. Tokyo’s underground flood tanks can store 13 million gallons. New York’s drainage network is 10,600 km long and smart-monitored. Singapore’s green roofs and swales mimic nature. India builds expressways through floodplains and calls it development.

But hope glimmers: Indore’s waste model and Meghalaya’s Umngot River protection show transformation is possible. It demands rage. It demands reform. It demands accountability.

🔥 This is Not Climate Change. This Is Civic Collapse.

Each death in the floods is a murder by neglect. Each overflowing drain is an indictment of the state. Each lost dream is a reminder that urban India is not drowning—it’s being drowned.

So here’s what we must demand—today, not tomorrow:

  • Separate stormwater and sewage networks.
  • Enforce river reserve zones.
  • Restore wetlands like Pallikaranai and the Ganga’s floodplains.
  • Jail corrupt officials and contractors.
  • Upgrade infrastructure with citizen oversight, not just cement.

When the rains return, will we still pretend this is fate? Or will we rise—with fists, with votes, with voices—to ensure this flood is the last?


Share is Caring, Choose Your Platform!

Recent Posts


  • In a diverse country like India, where each State is socially, culturally, economically, and politically distinct, measuring Governance becomes increasingly tricky. The Public Affairs Index (PAI 2021) is a scientifically rigorous, data-based framework that measures the quality of governance at the Sub-national level and ranks the States and Union Territories (UTs) of India on a Composite Index (CI).


    States are classified into two categories – Large and Small – using population as the criteria.

    In PAI 2021, PAC defined three significant pillars that embody GovernanceGrowth, Equity, and Sustainability. Each of the three Pillars is circumscribed by five governance praxis Themes.

    The themes include – Voice and Accountability, Government Effectiveness, Rule of Law, Regulatory Quality and Control of Corruption.

    At the bottom of the pyramid, 43 component indicators are mapped to 14 Sustainable Development Goals (SDGs) that are relevant to the States and UTs.

    This forms the foundation of the conceptual framework of PAI 2021. The choice of the 43 indicators that go into the calculation of the CI were dictated by the objective of uncovering the complexity and multidimensional character of development governance

    The Equity Principle

    The Equity Pillar of the PAI 2021 Index analyses the inclusiveness impact at the Sub-national level in the country; inclusiveness in terms of the welfare of a society that depends primarily on establishing that all people feel that they have a say in the governance and are not excluded from the mainstream policy framework.

    This requires all individuals and communities, but particularly the most vulnerable, to have an opportunity to improve or maintain their wellbeing. This chapter of PAI 2021 reflects the performance of States and UTs during the pandemic and questions the governance infrastructure in the country, analysing the effectiveness of schemes and the general livelihood of the people in terms of Equity.

    Growth and its Discontents

    Growth in its multidimensional form encompasses the essence of access to and the availability and optimal utilisation of resources. By resources, PAI 2021 refer to human resources, infrastructure and the budgetary allocations. Capacity building of an economy cannot take place if all the key players of growth do not drive development. The multiplier effects of better health care, improved educational outcomes, increased capital accumulation and lower unemployment levels contribute magnificently in the growth and development of the States.

    The Pursuit Of Sustainability

    The Sustainability Pillar analyses the access to and usage of resources that has an impact on environment, economy and humankind. The Pillar subsumes two themes and uses seven indicators to measure the effectiveness of government efforts with regards to Sustainability.


    The Curious Case Of The Delta

    The Delta Analysis presents the results on the State performance on year-on-year improvement. The rankings are measured as the Delta value over the last five to 10 years of data available for 12 Key Development Indicators (KDI). In PAI 2021, 12 indicators across the three Pillars of Equity (five indicators), Growth (five indicators) and Sustainability (two indicators). These KDIs are the outcome indicators crucial to assess Human Development. The Performance in the Delta Analysis is then compared to the Overall PAI 2021 Index.

    Key Findings:-

    1. In the Large States category (overall), Chhattisgarh ranks 1st, followed by Odisha and Telangana, whereas, towards the bottom are Maharashtra at 16th, Assam at 17th and Gujarat at 18th. Gujarat is one State that has seen startling performance ranking 5th in the PAI 2021 Index outperforming traditionally good performing States like Andhra Pradesh and Karnataka, but ranks last in terms of Delta
    2. In the Small States category (overall), Nagaland tops, followed by Mizoram and Tripura. Towards the tail end of the overall Delta ranking is Uttarakhand (9th), Arunachal Pradesh (10th) and Meghalaya (11th). Nagaland despite being a poor performer in the PAI 2021 Index has come out to be the top performer in Delta, similarly, Mizoram’s performance in Delta is also reflected in it’s ranking in the PAI 2021 Index
    3. In terms of Equity, in the Large States category, Chhattisgarh has the best Delta rate on Equity indicators, this is also reflected in the performance of Chhattisgarh in the Equity Pillar where it ranks 4th. Following Chhattisgarh is Odisha ranking 2nd in Delta-Equity ranking, but ranks 17th in the Equity Pillar of PAI 2021. Telangana ranks 3rd in Delta-Equity ranking even though it is not a top performer in this Pillar in the overall PAI 2021 Index. Jharkhand (16th), Uttar Pradesh (17th) and Assam (18th) rank at the bottom with Uttar Pradesh’s performance in line with the PAI 2021 Index
    4. Odisha and Nagaland have shown the best year-on-year improvement under 12 Key Development indicators.

    In the Scheme of Things

    The Scheme Analysis adds an additional dimension to ranking of the States on their governance. It attempts to complement the Governance Model by trying to understand the developmental activities undertaken by State Governments in the form of schemes. It also tries to understand whether better performance of States in schemes reflect in better governance.

    The Centrally Sponsored schemes that were analysed are National Health Mission (NHM), Umbrella Integrated Child Development Services scheme (ICDS), Mahatma Gandh National Rural Employment Guarantee Scheme (MGNREGS), Samagra Shiksha Abhiyan (SmSA) and MidDay Meal Scheme (MDMS).

    National Health Mission (NHM)

    • In the 60:40 division States, the top three performers are Kerala, Goa and Tamil Nadu and, the bottom three performers are Uttar Pradesh, Jharkhand and Bihar.
    • In the 90:10 division States, the top three performers were Himachal Pradesh, Sikkim and Mizoram; and, the bottom three performers are Manipur, Assam and Meghalaya.


    INTEGRATED CHILD DEVELOPMENT SERVICES (ICDS)

    • Among the 60:40 division States, Orissa, Chhattisgarh and Madhya Pradesh are the top three performers and Tamil Nadu, Telangana and Delhi appear as the bottom three performers.
    • Among the 90:10 division States, the top three performers are Manipur, Arunachal Pradesh and Nagaland; and, the bottom three performers are Jammu and Kashmir, Uttarakhand and Himachal Pradesh


    MID- DAY MEAL SCHEME (MDMS)

    • Among the 60:40 division States, Goa, West Bengal and Delhi appear as the top three performers and Andhra Pradesh, Telangana and Bihar appear as the bottom three performers.
    • Among the 90:10 division States, Mizoram, Himachal Pradesh and Tripura were the top three performers and Jammu & Kashmir, Nagaland and Arunachal Pradesh were the bottom three performers


    SAMAGRA SHIKSHA ABHIYAN (SMSA)

    • West Bengal, Bihar and Tamil Nadu were the top three States amongst the 60:40 division States; while Haryana, Punjab and Rajasthan appeared as the bottom three performers
    • In the case of 90:10 division States, Mizoram, Assam and Tripura were the top three performers and Nagaland, Jammu & Kashmir and Uttarakhand featured as the bottom three


    MAHATMA GANDHI NATIONAL RURAL EMPLOYMENT GUARANTEE SCHEME (MGNREGS)

    • Among the 60:40 division States, the top three performers are Kerala, Andhra Pradesh and Orissa and the bottom three performers are Madhya Pradesh, Jharkhand and Goa
    • In the 90:10 division States, the top three performers are Mizoram, Sikkim and Nagaland and the bottom three performers are Manipur and Assam