
The Arctic could be free of sea ice by 2040, 30 years earlier than previously suggested
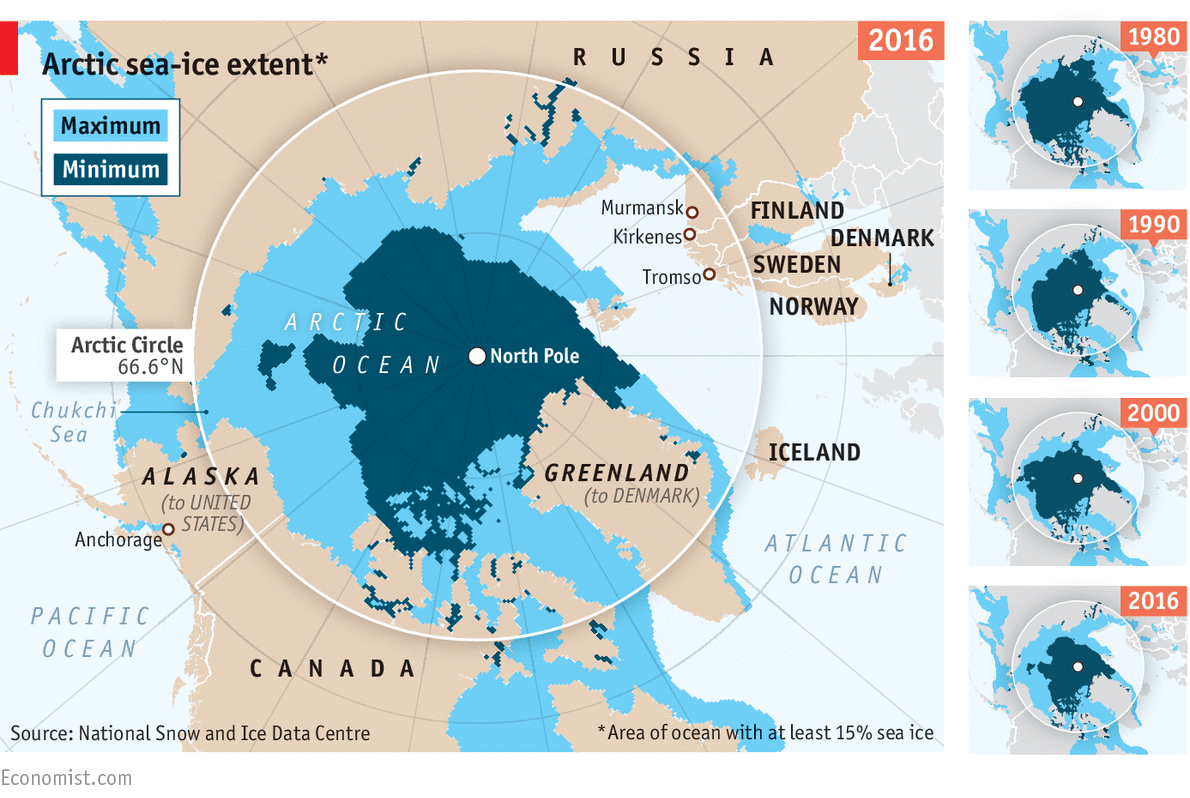
OVER the past three decades the area of sea ice in the Arctic has fallen by more than half and its volume has plummeted by three-quarters. So says a report “Snow, Water, Ice, Permafrost in the Arctic” (SWIPA), produced under the auspices of the Arctic Council (Prelims question in 2014), a scientific-policy club for the eight countries with territory in the Arctic Circle, as well as observers including China and India.
SWIPA estimates that the Arctic will be free of sea ice in the summer by 2040. Scientists previously suggested this would not occur until 2070. The thickness of ice in the central Arctic ocean declined by 65% between 1975 and 2012; record lows in the maximum extent of Arctic sea ice occurred in March.
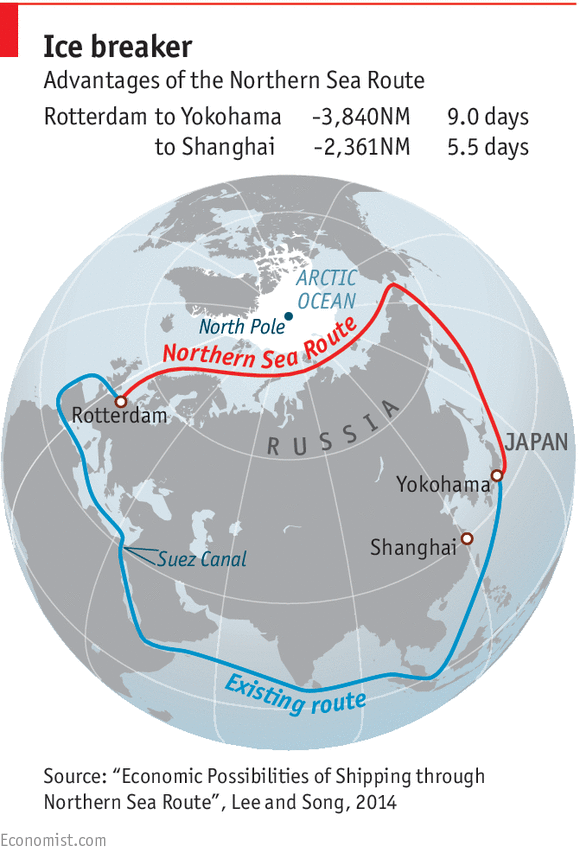
In theory shipping firms should benefit from access to a more open seaway. Using it to sail from northern Europe to north-east Asia can cut the length of voyages by two-fifths compared with travelling via the Suez Canal. But any Arctic promise has drifted away and the expected shipping boom has not materialised. In 2012 only 1m tonnes of goods were shipped through the northern passage, a paltry level of activity yet one not achieved since.
Even in the summer months the Arctic ocean is stormy, making timely delivery of goods impossible to guarantee. Drifting ice also poses a danger. Ships must be strengthened to withstand it, adding to construction costs. And a lack of coastal infrastructure, such as deepwater ports, means that spills of the heavy fuel oil that powers most vessels could wreak havoc on both ecosystems and reputations, because clean-up missions would have to set out from much farther away and would take much longer to be effective.
A new Polar Code from the International Maritime Organisation, which regulates shipping, came into force at the beginning of the year to try to address some of these concerns. It bans discharges of sewage and oily mixtures in polar waters. America and Canada, among others, want to go further. For one thing, they want a ban on heavy fuel-oil (as there is in the Antarctic, which has various special protections).
Nothing, however, looms larger than the potential for environmental calamity. The question of thawing is rising up the list of priorities both of countries with territory in the region and those farther afield. Sticking to the Paris agreement could, eventually, stabilise temperatures. But more radical measures may be needed given that countries are unlikely to keep within the limits set in Paris.
Polar Code
IMO has adopted the International Code for Ships Operating in Polar Waters (Polar Code) and related amendments to make it mandatory under both the International Convention for the Safety of Life at Sea (SOLAS) and the International Convention for the Prevention of Pollution from Ships (MARPOL).
The Polar Code entered into force on 1 January 2017. This marks an historic milestone in the Organization’s work to protect ships and people aboard them, both seafarers and passengers, in the harsh environment of the waters surrounding the two poles.
The Polar Code and SOLAS amendments were adopted during the 94th session of IMO’s Maritime Safety Committee (MSC), in November 2014; the environmental provisions and MARPOL amendments were adopted during the 68th session of the Marine Environment Protection Committee (MEPC) in May 2015.
The Polar Code covers the full range of design, construction, equipment, operational, training, search and rescue and environmental protection matters relevant to ships operating in the inhospitable waters surrounding the two poles.
The Polar Code includes mandatory measures covering safety part (part I-A) and pollution prevention (part II-A) and recommendatory provisions for both (parts I-B and II-B).
Whilst Arctic and Antarctic waters have a number of similarities, there are also significant differences. The Arctic is an ocean surrounded by continents while the Antarctic is a continent surrounded by an ocean. The Antarctic sea ice retreats significantly during the summer season or is dispersed by permanent gyres in the two major seas of the Antarctic: the Weddell and the Ross. Thus there is relatively little multi-year ice in the Antarctic. Conversely, Arctic sea ice survives many summer seasons and there is a significant amount of multi-year ice. Whilst the marine environments of both Polar seas are similarly vulnerable, response to such challenge should duly take into account specific features of the legal and political regimes applicable to their respective marine spaces.
Receive Daily Updates
Recent Posts
- In the Large States category (overall), Chhattisgarh ranks 1st, followed by Odisha and Telangana, whereas, towards the bottom are Maharashtra at 16th, Assam at 17th and Gujarat at 18th. Gujarat is one State that has seen startling performance ranking 5th in the PAI 2021 Index outperforming traditionally good performing States like Andhra Pradesh and Karnataka, but ranks last in terms of Delta
- In the Small States category (overall), Nagaland tops, followed by Mizoram and Tripura. Towards the tail end of the overall Delta ranking is Uttarakhand (9th), Arunachal Pradesh (10th) and Meghalaya (11th). Nagaland despite being a poor performer in the PAI 2021 Index has come out to be the top performer in Delta, similarly, Mizoram’s performance in Delta is also reflected in it’s ranking in the PAI 2021 Index
- In terms of Equity, in the Large States category, Chhattisgarh has the best Delta rate on Equity indicators, this is also reflected in the performance of Chhattisgarh in the Equity Pillar where it ranks 4th. Following Chhattisgarh is Odisha ranking 2nd in Delta-Equity ranking, but ranks 17th in the Equity Pillar of PAI 2021. Telangana ranks 3rd in Delta-Equity ranking even though it is not a top performer in this Pillar in the overall PAI 2021 Index. Jharkhand (16th), Uttar Pradesh (17th) and Assam (18th) rank at the bottom with Uttar Pradesh’s performance in line with the PAI 2021 Index
- Odisha and Nagaland have shown the best year-on-year improvement under 12 Key Development indicators.
- In the 60:40 division States, the top three performers are Kerala, Goa and Tamil Nadu and, the bottom three performers are Uttar Pradesh, Jharkhand and Bihar.
- In the 90:10 division States, the top three performers were Himachal Pradesh, Sikkim and Mizoram; and, the bottom three performers are Manipur, Assam and Meghalaya.
- Among the 60:40 division States, Orissa, Chhattisgarh and Madhya Pradesh are the top three performers and Tamil Nadu, Telangana and Delhi appear as the bottom three performers.
- Among the 90:10 division States, the top three performers are Manipur, Arunachal Pradesh and Nagaland; and, the bottom three performers are Jammu and Kashmir, Uttarakhand and Himachal Pradesh
- Among the 60:40 division States, Goa, West Bengal and Delhi appear as the top three performers and Andhra Pradesh, Telangana and Bihar appear as the bottom three performers.
- Among the 90:10 division States, Mizoram, Himachal Pradesh and Tripura were the top three performers and Jammu & Kashmir, Nagaland and Arunachal Pradesh were the bottom three performers
- West Bengal, Bihar and Tamil Nadu were the top three States amongst the 60:40 division States; while Haryana, Punjab and Rajasthan appeared as the bottom three performers
- In the case of 90:10 division States, Mizoram, Assam and Tripura were the top three performers and Nagaland, Jammu & Kashmir and Uttarakhand featured as the bottom three
- Among the 60:40 division States, the top three performers are Kerala, Andhra Pradesh and Orissa and the bottom three performers are Madhya Pradesh, Jharkhand and Goa
- In the 90:10 division States, the top three performers are Mizoram, Sikkim and Nagaland and the bottom three performers are Manipur and Assam
In a diverse country like India, where each State is socially, culturally, economically, and politically distinct, measuring Governance becomes increasingly tricky. The Public Affairs Index (PAI 2021) is a scientifically rigorous, data-based framework that measures the quality of governance at the Sub-national level and ranks the States and Union Territories (UTs) of India on a Composite Index (CI).
States are classified into two categories – Large and Small – using population as the criteria.
In PAI 2021, PAC defined three significant pillars that embody Governance – Growth, Equity, and Sustainability. Each of the three Pillars is circumscribed by five governance praxis Themes.
The themes include – Voice and Accountability, Government Effectiveness, Rule of Law, Regulatory Quality and Control of Corruption.
At the bottom of the pyramid, 43 component indicators are mapped to 14 Sustainable Development Goals (SDGs) that are relevant to the States and UTs.
This forms the foundation of the conceptual framework of PAI 2021. The choice of the 43 indicators that go into the calculation of the CI were dictated by the objective of uncovering the complexity and multidimensional character of development governance

The Equity Principle
The Equity Pillar of the PAI 2021 Index analyses the inclusiveness impact at the Sub-national level in the country; inclusiveness in terms of the welfare of a society that depends primarily on establishing that all people feel that they have a say in the governance and are not excluded from the mainstream policy framework.
This requires all individuals and communities, but particularly the most vulnerable, to have an opportunity to improve or maintain their wellbeing. This chapter of PAI 2021 reflects the performance of States and UTs during the pandemic and questions the governance infrastructure in the country, analysing the effectiveness of schemes and the general livelihood of the people in terms of Equity.


Growth and its Discontents
Growth in its multidimensional form encompasses the essence of access to and the availability and optimal utilisation of resources. By resources, PAI 2021 refer to human resources, infrastructure and the budgetary allocations. Capacity building of an economy cannot take place if all the key players of growth do not drive development. The multiplier effects of better health care, improved educational outcomes, increased capital accumulation and lower unemployment levels contribute magnificently in the growth and development of the States.


The Pursuit Of Sustainability
The Sustainability Pillar analyses the access to and usage of resources that has an impact on environment, economy and humankind. The Pillar subsumes two themes and uses seven indicators to measure the effectiveness of government efforts with regards to Sustainability.


The Curious Case Of The Delta
The Delta Analysis presents the results on the State performance on year-on-year improvement. The rankings are measured as the Delta value over the last five to 10 years of data available for 12 Key Development Indicators (KDI). In PAI 2021, 12 indicators across the three Pillars of Equity (five indicators), Growth (five indicators) and Sustainability (two indicators). These KDIs are the outcome indicators crucial to assess Human Development. The Performance in the Delta Analysis is then compared to the Overall PAI 2021 Index.
Key Findings:-
In the Scheme of Things
The Scheme Analysis adds an additional dimension to ranking of the States on their governance. It attempts to complement the Governance Model by trying to understand the developmental activities undertaken by State Governments in the form of schemes. It also tries to understand whether better performance of States in schemes reflect in better governance.
The Centrally Sponsored schemes that were analysed are National Health Mission (NHM), Umbrella Integrated Child Development Services scheme (ICDS), Mahatma Gandh National Rural Employment Guarantee Scheme (MGNREGS), Samagra Shiksha Abhiyan (SmSA) and MidDay Meal Scheme (MDMS).
National Health Mission (NHM)
INTEGRATED CHILD DEVELOPMENT SERVICES (ICDS)
MID- DAY MEAL SCHEME (MDMS)
SAMAGRA SHIKSHA ABHIYAN (SMSA)
MAHATMA GANDHI NATIONAL RURAL EMPLOYMENT GUARANTEE SCHEME (MGNREGS)