
INDUSTRIAL policy via Twitter is a new development in economics but we may all have to get used to it over the next four (or eight) years. Donald Trump’s tweets on the car industry (and his planned cuts to corporate income tax) may or may not have persuaded Ford to keep a plant in Michigan, creating 700 jobs. But the problem with such headline-grabbing is that there are thousands of companies in America, and jobs are being created or destroyed every day; intervening in all these situations is impossible. Even in cars, for example, GM has recently announced 3,300 lay-offs , almost five times greater than the Ford additions.
History suggests that the aim of creating large numbers of manufacturing jobs will be a lost cause.
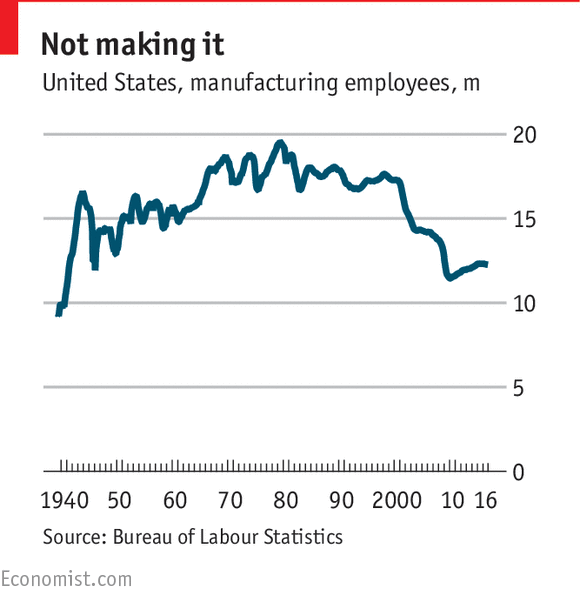
In 1979, the high point for American manufacturing jobs was reached at 19.5m. The subsequent recession of the early 1980s caused that number to fall but there were regularly 17m-18m jobs in the 1980s and 1990s. From the turn of the millennium, however, the total fell pretty remorselessly, with the 2008-09 recession proving the coup de grace. The low was just under 11.5m in early 2010. As the economy recovered, some jobs returned and a peak of 12.3m was reached early last year. But since then, the numbers have been drifting down again
The same kind of declines have been seen across the developed world, indicating that this is not a particular problem of American economic policy. A report from the Congressional Research Service sets the context; America’s share of global manufacturing value added fell 12 percentage points between 1993 and 2014 but Japan’s share fell 14 points over the same period.
Unsurprisingly, China has taken the bulk of the market share.
In terms of employment, the 31% decline in America between 1990 and 2014 compared with a 25% fall in Germany, 33% declines in France and Sweden, 34% in Japan and 49% in the UK.
The problem is not just China but technology.
Industries, like cars and steel, tend to be plagued by overcapacity. There can be good times in the cycle (American car sales are setting new records, for example). The 2008-09 slump caused people to postpone their purchases but eventually confidence recovered; cars wear out and must be replaced. But a downturn will inevitably come;research suggest that consumers’ budgets are stretched, leading them to finance today’s car buys over six to seven years, delaying the next car purchase. A competitive market means that car manufacturers must keep investing to add new features while keeping prices down; that may mean replacing people with machines. It also means that a lot of the value added in a car comes from the software that runs it; jobs that tend to go to college graduates or are not found in rustbelt states. In Britain, the share of low-skilled manufacturing jobs has fallen since the 2008 recession while foreign-born workers comprise 17% of the total, similar to banking. The service sector contributes more than 30% of value added in American manufacturing and more than 40% in France and Italy.
And herein lies the problem of focusing on manufacturing jobs which comprise just 10% of all employment in America (in percentage terms, there has been a virtually uninterrupted . Slapping on tariffs to punish manufacturers who export jobs makes little sense in a world of global value chains, every dollar of Mexican goods exported to America contains 40 cents of American goods embedded within it. Worse still, the disruption to trade in services that might result, let alone the higher prices that consumers would have to pay, would far outweigh the positive impact of keeping a few jobs in America.
The markets seem remarkably sanguine about all this; far more so than they would have done if a President Bernie Sanders were threatening American businesses with retaliation. But we have seen individual stocks take a hit (Boeing , for example) when they came into the Twitter firing line of Mr Trump. Eventually, one thinks, the unpredictability of the attacks will wear out investors’ nerves.
Receive Daily Updates
Recent Posts
- In the Large States category (overall), Chhattisgarh ranks 1st, followed by Odisha and Telangana, whereas, towards the bottom are Maharashtra at 16th, Assam at 17th and Gujarat at 18th. Gujarat is one State that has seen startling performance ranking 5th in the PAI 2021 Index outperforming traditionally good performing States like Andhra Pradesh and Karnataka, but ranks last in terms of Delta
- In the Small States category (overall), Nagaland tops, followed by Mizoram and Tripura. Towards the tail end of the overall Delta ranking is Uttarakhand (9th), Arunachal Pradesh (10th) and Meghalaya (11th). Nagaland despite being a poor performer in the PAI 2021 Index has come out to be the top performer in Delta, similarly, Mizoram’s performance in Delta is also reflected in it’s ranking in the PAI 2021 Index
- In terms of Equity, in the Large States category, Chhattisgarh has the best Delta rate on Equity indicators, this is also reflected in the performance of Chhattisgarh in the Equity Pillar where it ranks 4th. Following Chhattisgarh is Odisha ranking 2nd in Delta-Equity ranking, but ranks 17th in the Equity Pillar of PAI 2021. Telangana ranks 3rd in Delta-Equity ranking even though it is not a top performer in this Pillar in the overall PAI 2021 Index. Jharkhand (16th), Uttar Pradesh (17th) and Assam (18th) rank at the bottom with Uttar Pradesh’s performance in line with the PAI 2021 Index
- Odisha and Nagaland have shown the best year-on-year improvement under 12 Key Development indicators.
- In the 60:40 division States, the top three performers are Kerala, Goa and Tamil Nadu and, the bottom three performers are Uttar Pradesh, Jharkhand and Bihar.
- In the 90:10 division States, the top three performers were Himachal Pradesh, Sikkim and Mizoram; and, the bottom three performers are Manipur, Assam and Meghalaya.
- Among the 60:40 division States, Orissa, Chhattisgarh and Madhya Pradesh are the top three performers and Tamil Nadu, Telangana and Delhi appear as the bottom three performers.
- Among the 90:10 division States, the top three performers are Manipur, Arunachal Pradesh and Nagaland; and, the bottom three performers are Jammu and Kashmir, Uttarakhand and Himachal Pradesh
- Among the 60:40 division States, Goa, West Bengal and Delhi appear as the top three performers and Andhra Pradesh, Telangana and Bihar appear as the bottom three performers.
- Among the 90:10 division States, Mizoram, Himachal Pradesh and Tripura were the top three performers and Jammu & Kashmir, Nagaland and Arunachal Pradesh were the bottom three performers
- West Bengal, Bihar and Tamil Nadu were the top three States amongst the 60:40 division States; while Haryana, Punjab and Rajasthan appeared as the bottom three performers
- In the case of 90:10 division States, Mizoram, Assam and Tripura were the top three performers and Nagaland, Jammu & Kashmir and Uttarakhand featured as the bottom three
- Among the 60:40 division States, the top three performers are Kerala, Andhra Pradesh and Orissa and the bottom three performers are Madhya Pradesh, Jharkhand and Goa
- In the 90:10 division States, the top three performers are Mizoram, Sikkim and Nagaland and the bottom three performers are Manipur and Assam
In a diverse country like India, where each State is socially, culturally, economically, and politically distinct, measuring Governance becomes increasingly tricky. The Public Affairs Index (PAI 2021) is a scientifically rigorous, data-based framework that measures the quality of governance at the Sub-national level and ranks the States and Union Territories (UTs) of India on a Composite Index (CI).
States are classified into two categories – Large and Small – using population as the criteria.
In PAI 2021, PAC defined three significant pillars that embody Governance – Growth, Equity, and Sustainability. Each of the three Pillars is circumscribed by five governance praxis Themes.
The themes include – Voice and Accountability, Government Effectiveness, Rule of Law, Regulatory Quality and Control of Corruption.
At the bottom of the pyramid, 43 component indicators are mapped to 14 Sustainable Development Goals (SDGs) that are relevant to the States and UTs.
This forms the foundation of the conceptual framework of PAI 2021. The choice of the 43 indicators that go into the calculation of the CI were dictated by the objective of uncovering the complexity and multidimensional character of development governance

The Equity Principle
The Equity Pillar of the PAI 2021 Index analyses the inclusiveness impact at the Sub-national level in the country; inclusiveness in terms of the welfare of a society that depends primarily on establishing that all people feel that they have a say in the governance and are not excluded from the mainstream policy framework.
This requires all individuals and communities, but particularly the most vulnerable, to have an opportunity to improve or maintain their wellbeing. This chapter of PAI 2021 reflects the performance of States and UTs during the pandemic and questions the governance infrastructure in the country, analysing the effectiveness of schemes and the general livelihood of the people in terms of Equity.


Growth and its Discontents
Growth in its multidimensional form encompasses the essence of access to and the availability and optimal utilisation of resources. By resources, PAI 2021 refer to human resources, infrastructure and the budgetary allocations. Capacity building of an economy cannot take place if all the key players of growth do not drive development. The multiplier effects of better health care, improved educational outcomes, increased capital accumulation and lower unemployment levels contribute magnificently in the growth and development of the States.


The Pursuit Of Sustainability
The Sustainability Pillar analyses the access to and usage of resources that has an impact on environment, economy and humankind. The Pillar subsumes two themes and uses seven indicators to measure the effectiveness of government efforts with regards to Sustainability.


The Curious Case Of The Delta
The Delta Analysis presents the results on the State performance on year-on-year improvement. The rankings are measured as the Delta value over the last five to 10 years of data available for 12 Key Development Indicators (KDI). In PAI 2021, 12 indicators across the three Pillars of Equity (five indicators), Growth (five indicators) and Sustainability (two indicators). These KDIs are the outcome indicators crucial to assess Human Development. The Performance in the Delta Analysis is then compared to the Overall PAI 2021 Index.
Key Findings:-
In the Scheme of Things
The Scheme Analysis adds an additional dimension to ranking of the States on their governance. It attempts to complement the Governance Model by trying to understand the developmental activities undertaken by State Governments in the form of schemes. It also tries to understand whether better performance of States in schemes reflect in better governance.
The Centrally Sponsored schemes that were analysed are National Health Mission (NHM), Umbrella Integrated Child Development Services scheme (ICDS), Mahatma Gandh National Rural Employment Guarantee Scheme (MGNREGS), Samagra Shiksha Abhiyan (SmSA) and MidDay Meal Scheme (MDMS).
National Health Mission (NHM)
INTEGRATED CHILD DEVELOPMENT SERVICES (ICDS)
MID- DAY MEAL SCHEME (MDMS)
SAMAGRA SHIKSHA ABHIYAN (SMSA)
MAHATMA GANDHI NATIONAL RURAL EMPLOYMENT GUARANTEE SCHEME (MGNREGS)