
Animals in our backyard:-
Monkeys, along with Grey langurs and bonnet macaques, have adapted to urban habitats over the years.Out of the nearly 225 living species of non-human primates, these three species have adapted to the urban way of life.

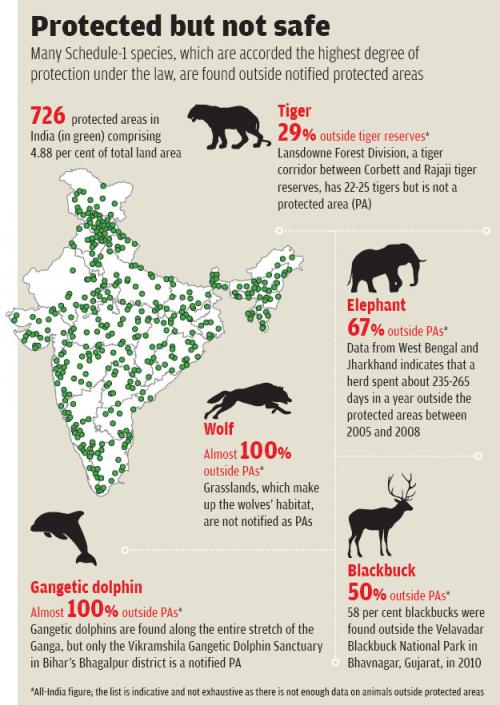
In case of other animals, India does not lack protected areas, but the very idea of a protected area appears skewed. The protected areas were historically meant to be the breeding grounds for animals raised in the wild for the purpose of hunting.This space is not enough to have a full-fledged habitat for wild animals.
A territorial animal like a male tiger needs an area of 60-100 sq km. But the area allocated to an entire tiger reserve, like the Bor Tiger Reserve in Maharashtra, is 138.12 sq km. This is barely enough for one or two tigers.
The elephants need to travel at least 10-20 km a day. If a herd is restricted to an area of about 100 sq km, they are bound to move out in search of food and water. Elephants are used to travelling long distances, most of which fall outside the protected areas.
The condition of the existing protected areas is not very good, either. Wildlife experts claim that territorial animals do not have enough space within reserves and their prey do not have enough fodder to thrive on. This is forcing the wild animals to move out and venture close to human habitation in search of food.
Rising numbers
The population of monkeys has multiplied after their natural habitat was destroyed because of their ability to adapt to new habitats. In forests, a Rhesus macaque has to spend about 10 to 14 hours in search of food. However, if we look at the street-dwelling urban monkeys or even those living dangerously close to human settlements in a rural setting, finding food takes only 10 minutes.When there is food in abundance, monkeys spend more time procreating.
A primary reason for the increasing human-animal conflicts is the presence of a large number of animals and birds outside the notified protected areas. Wildlife experts estimate that 29 per cent of the tigers in India are outside the protected areas. “If we take their number to be 2,200, the tigers outside the protected areas are about 640. This is almost twice the number of tigers found in Russia.
Government action may fail to yield results
Another reason why animals move to new geographical areas is the government’s practice of translocating monkeys from the cities to forest areas near rural areas. Residents of Chaukha village, which is at an altitude of 2,072 metres above sea level, say monkeys were brought to the forests from Shimla and Mandi. Monkeys are never found at such high altitudes. But the government forcefully dumped the animals in our forests.
Even Delhi’s attempt to translocate monkeys has backfired. In 2007, the state wildlife department captured over 19,000 monkeys to translocate them to a wildlife sanctuary created at Asola Bhatti mines on the outskirts of the city. While New Delhi breathed a temporary sigh of relief by the move, the residents of Sanjay Colony near the sanctuary struggled. The illegal colony of the Od community, who for three decades mined Bhatti area of the Aravalli hills, registered an alarmingly high number of attacks by monkeys who would escape the sanctuary.
State governments have tried various strategies so far—from culling and sterilisation drives to awareness campaigns not to feed monkeys. In Himachal Pradesh, the sterilisation rate at the centres has been poor. On an average, each camp has the capacity to sterilise 45 monkeys every day. This adds up to 54,000 sterilisations every year or 430,000 sterilisations in the past eight years. But just 96,500 monkeys have been sterilised since 2007.
Wildlife experts warn that if wildlife protection is confined to reserves and parks alone, several species will stand at the brink of extinction. This is best exemplified by the Great Indian Bustard, which is a Schedule-I animal. Despite having sanctuaries to itself, the bird has been driven to the brink of extinction. Various bustard sanctuaries had sizeable population once upon a time. But as of March 2015, there are an estimated 169 birds left. The problem is how do you restrict a bird? They fly out of the protected areas and are then hunted for their meat.
Receive Daily Updates
Recent Posts
- In the Large States category (overall), Chhattisgarh ranks 1st, followed by Odisha and Telangana, whereas, towards the bottom are Maharashtra at 16th, Assam at 17th and Gujarat at 18th. Gujarat is one State that has seen startling performance ranking 5th in the PAI 2021 Index outperforming traditionally good performing States like Andhra Pradesh and Karnataka, but ranks last in terms of Delta
- In the Small States category (overall), Nagaland tops, followed by Mizoram and Tripura. Towards the tail end of the overall Delta ranking is Uttarakhand (9th), Arunachal Pradesh (10th) and Meghalaya (11th). Nagaland despite being a poor performer in the PAI 2021 Index has come out to be the top performer in Delta, similarly, Mizoram’s performance in Delta is also reflected in it’s ranking in the PAI 2021 Index
- In terms of Equity, in the Large States category, Chhattisgarh has the best Delta rate on Equity indicators, this is also reflected in the performance of Chhattisgarh in the Equity Pillar where it ranks 4th. Following Chhattisgarh is Odisha ranking 2nd in Delta-Equity ranking, but ranks 17th in the Equity Pillar of PAI 2021. Telangana ranks 3rd in Delta-Equity ranking even though it is not a top performer in this Pillar in the overall PAI 2021 Index. Jharkhand (16th), Uttar Pradesh (17th) and Assam (18th) rank at the bottom with Uttar Pradesh’s performance in line with the PAI 2021 Index
- Odisha and Nagaland have shown the best year-on-year improvement under 12 Key Development indicators.
- In the 60:40 division States, the top three performers are Kerala, Goa and Tamil Nadu and, the bottom three performers are Uttar Pradesh, Jharkhand and Bihar.
- In the 90:10 division States, the top three performers were Himachal Pradesh, Sikkim and Mizoram; and, the bottom three performers are Manipur, Assam and Meghalaya.
- Among the 60:40 division States, Orissa, Chhattisgarh and Madhya Pradesh are the top three performers and Tamil Nadu, Telangana and Delhi appear as the bottom three performers.
- Among the 90:10 division States, the top three performers are Manipur, Arunachal Pradesh and Nagaland; and, the bottom three performers are Jammu and Kashmir, Uttarakhand and Himachal Pradesh
- Among the 60:40 division States, Goa, West Bengal and Delhi appear as the top three performers and Andhra Pradesh, Telangana and Bihar appear as the bottom three performers.
- Among the 90:10 division States, Mizoram, Himachal Pradesh and Tripura were the top three performers and Jammu & Kashmir, Nagaland and Arunachal Pradesh were the bottom three performers
- West Bengal, Bihar and Tamil Nadu were the top three States amongst the 60:40 division States; while Haryana, Punjab and Rajasthan appeared as the bottom three performers
- In the case of 90:10 division States, Mizoram, Assam and Tripura were the top three performers and Nagaland, Jammu & Kashmir and Uttarakhand featured as the bottom three
- Among the 60:40 division States, the top three performers are Kerala, Andhra Pradesh and Orissa and the bottom three performers are Madhya Pradesh, Jharkhand and Goa
- In the 90:10 division States, the top three performers are Mizoram, Sikkim and Nagaland and the bottom three performers are Manipur and Assam
In a diverse country like India, where each State is socially, culturally, economically, and politically distinct, measuring Governance becomes increasingly tricky. The Public Affairs Index (PAI 2021) is a scientifically rigorous, data-based framework that measures the quality of governance at the Sub-national level and ranks the States and Union Territories (UTs) of India on a Composite Index (CI).
States are classified into two categories – Large and Small – using population as the criteria.
In PAI 2021, PAC defined three significant pillars that embody Governance – Growth, Equity, and Sustainability. Each of the three Pillars is circumscribed by five governance praxis Themes.
The themes include – Voice and Accountability, Government Effectiveness, Rule of Law, Regulatory Quality and Control of Corruption.
At the bottom of the pyramid, 43 component indicators are mapped to 14 Sustainable Development Goals (SDGs) that are relevant to the States and UTs.
This forms the foundation of the conceptual framework of PAI 2021. The choice of the 43 indicators that go into the calculation of the CI were dictated by the objective of uncovering the complexity and multidimensional character of development governance

The Equity Principle
The Equity Pillar of the PAI 2021 Index analyses the inclusiveness impact at the Sub-national level in the country; inclusiveness in terms of the welfare of a society that depends primarily on establishing that all people feel that they have a say in the governance and are not excluded from the mainstream policy framework.
This requires all individuals and communities, but particularly the most vulnerable, to have an opportunity to improve or maintain their wellbeing. This chapter of PAI 2021 reflects the performance of States and UTs during the pandemic and questions the governance infrastructure in the country, analysing the effectiveness of schemes and the general livelihood of the people in terms of Equity.


Growth and its Discontents
Growth in its multidimensional form encompasses the essence of access to and the availability and optimal utilisation of resources. By resources, PAI 2021 refer to human resources, infrastructure and the budgetary allocations. Capacity building of an economy cannot take place if all the key players of growth do not drive development. The multiplier effects of better health care, improved educational outcomes, increased capital accumulation and lower unemployment levels contribute magnificently in the growth and development of the States.


The Pursuit Of Sustainability
The Sustainability Pillar analyses the access to and usage of resources that has an impact on environment, economy and humankind. The Pillar subsumes two themes and uses seven indicators to measure the effectiveness of government efforts with regards to Sustainability.


The Curious Case Of The Delta
The Delta Analysis presents the results on the State performance on year-on-year improvement. The rankings are measured as the Delta value over the last five to 10 years of data available for 12 Key Development Indicators (KDI). In PAI 2021, 12 indicators across the three Pillars of Equity (five indicators), Growth (five indicators) and Sustainability (two indicators). These KDIs are the outcome indicators crucial to assess Human Development. The Performance in the Delta Analysis is then compared to the Overall PAI 2021 Index.
Key Findings:-
In the Scheme of Things
The Scheme Analysis adds an additional dimension to ranking of the States on their governance. It attempts to complement the Governance Model by trying to understand the developmental activities undertaken by State Governments in the form of schemes. It also tries to understand whether better performance of States in schemes reflect in better governance.
The Centrally Sponsored schemes that were analysed are National Health Mission (NHM), Umbrella Integrated Child Development Services scheme (ICDS), Mahatma Gandh National Rural Employment Guarantee Scheme (MGNREGS), Samagra Shiksha Abhiyan (SmSA) and MidDay Meal Scheme (MDMS).
National Health Mission (NHM)
INTEGRATED CHILD DEVELOPMENT SERVICES (ICDS)
MID- DAY MEAL SCHEME (MDMS)
SAMAGRA SHIKSHA ABHIYAN (SMSA)
MAHATMA GANDHI NATIONAL RURAL EMPLOYMENT GUARANTEE SCHEME (MGNREGS)