
Diabetes
A SILENT KILLER
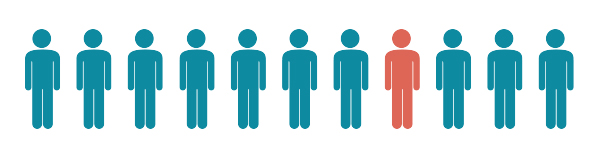
One in every 11 adults has diabetes
415 million
China and India have the highest number of people with diabetes — 110 million and 69 million, respectively — whereas the highest prevalence was found in the Pacific Islands of Tokelu and Nauru, where 30 per cent and 24 per cent of all adults are estimated to be living with diabetes.

children under the age of 15 suffering from type 1 diabetes in India
70,000
Another 40,000 have been diagnosed with Type 2 diabetes and this figure is growing by 5 per cent each year.

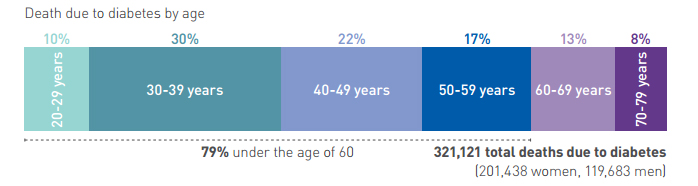
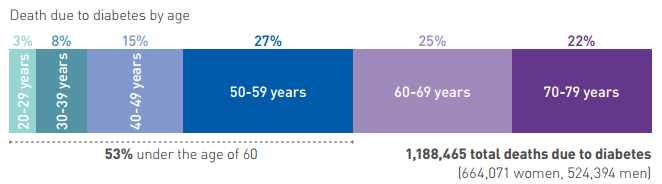
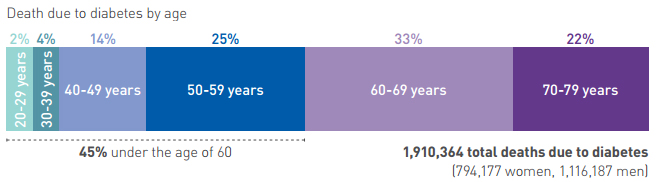
Every 6 seconds, a person dies from diabetes
5 million deaths
The number of diabetes cases has climbed 4.4 per cent over the past two years and is more than 5 per cent of the world’s population.

One in 7 births is affected by
gestational diabetes
More than 20.9 million live births were affected by diabetes during pregnancy in 2015.
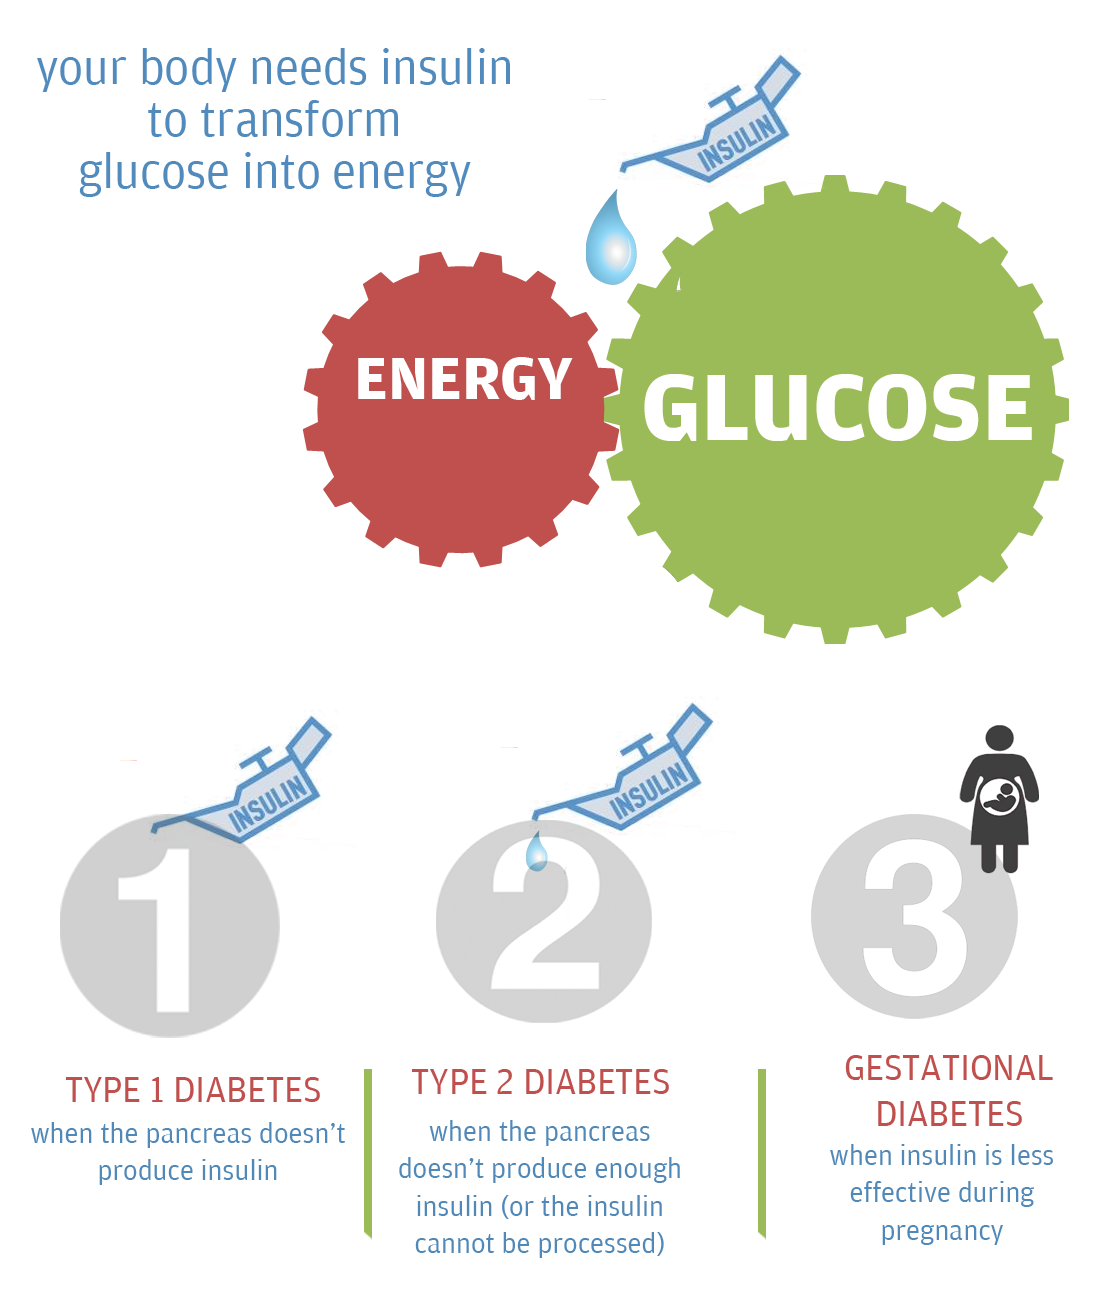
What is diabetes?
DIABETES | ACROSS THE GLOBE
The number of people living with diabetes has almost quadrupled since 1980 to 422 million adults, with most living in developing countries. Factors driving this dramatic rise include obesity
According to a Lancet study, China, India and USA are among the top three countries with a high number of diabetic patients. While the numbers climbed from 20.4 million in China in 1980 to 102.9 million in 2014, the rise has been equally dramatic in India from 11.9 million in 1980 to 64.5 million in 2014. Prevalence of diabetes has more than doubled for men in India and China (3.7 per cent to 9.1 per cent in India and 3.5 per cent to 9.9 per cent in China). It has also increased by 50 per cent among women in China (5 per cent to 7.6 per cent) and 80 per cent among women in India (4.6 per cent to 8.3 per cent).
IN AFRICA
In Africa, more than two thirds of the population with diabetes are undiagnosed
An estimated 14.2 (9.5-29.4‡) million adults aged 20-79 have diabetes in the Africa Region, representing a regional prevalence of 2.1-6.7 per cent‡. The Africa Region has the highest proportion of undiagnosed diabetes; over two thirds (66.7 per cent) of people with diabetes are unaware that they have the disease.
The majority (58.8 per cent) of people with diabetes live in cities, even though the population in the region is predominantly (61.3 per cent) rural. Diabetes in adults is in general much higher on islands in the Africa Region, compared to the mainland.
The highest prevalence is found in the Seychelles (17.4 per cent age-adjusted comparative prevalence, 17.4 per cent raw prevalence), followed by the island of Reunion (15.8 per cent age-adjusted, 18.2 per cent raw) and Comoros (9.9 per cent age-adjusted, 7.5 per cent raw). Some of Africa’s most populous countries have the highest numbers of people with diabetes, including South Africa (2.3 [1.2-4.6‡] million), Democratic Republic of Congo (1.8 [1.5-2.2‡] million), Nigeria (1.6 [1.2-3.8‡] million) and Ethiopia (1.3 [0.8-3.5‡] million). Nearly half of all adults with diabetes in the region live in these four countries
IN AMERICA
One adult in eight has diabetes in the North America and Caribbean regions.
With 12.9 per cent (10.8-14.5 per cent‡) of the adult population affected, the North America and Caribbean Region has the highest prevalence of diabetes compared to the other IDF regions. An estimated 44.3 (37.1-49.9‡) million people with diabetes aged 20-79 lived in the region in 2015, of which 13.3 million (29.9 per cent) are undiagnosed. The vast majority of people with diabetes (82.6 per cent) are living in urban areas.
Most of the people in the region live in the US, Mexico and Canada, which also account for the large majority of the number of people with diabetes. Over 92 per cent of the countries and territories in the region have an age-adjusted comparative diabetes prevalence rate above the global average (8.8 per cent), with Canada and Haiti being the only exceptions at 7.4 per cent and 6.9 per cent respectively
IN Europe
Europe has the highest prevalence of children with Type 1 diabetes
The number of people with diabetes is estimated to be 59.8 (45.1-85.6‡) million (9.1 per cent [6.8-13.0 per cent‡] of the population aged 20-79), including 23.5 million undiagnosed cases. While the Europe Region has the second-lowest age-adjusted comparative diabetes prevalence rate of any IDF region (after the Africa Region) there are still many countries with relatively high diabetes prevalence rates.
Turkey has the highest age-adjusted comparative prevalence (12.8 per cent comparative prevalence, 12.5 per cent raw prevalence) and the third-highest number of people with diabetes in the Europe Region (6.3 [5.7-7.5‡] million), after Germany (6.5 [5.9-7.5‡] million) and the Russian Federation (12.1 [6.2-17.0‡] million).
IN South East Asia
One quarter of all births are affected by high blood glucose during pregnancy in Southeast Asia.
Estimates in 2015 indicate that 8.5 per cent (6.8-10.8%‡) of the adult population has diabetes. This is equivalent to 78.3 (62.9 to 100.4‡) million people living with diabetes. Over half (52.1 per cent) of these are undiagnosed. Although only one third (32.5 per cent) of adults in the Southeast Asia Region lived in urban areas in 2015, nearly half (47.5 per cent) of all adults with diabetes can be found in cities.
India is home to the second largest number of children with Type 1 diabetes in the world (70,200), after the US, and accounts for the majority of the children with Type 1 diabetes in the region. The incidence rate for Type 1 diabetes in India was used to extrapolate figures for other similar countries, and therefore plays a pivotal role in the regional and global estimates.
IN Western Pacific Region
37 per cent of all adults with diabetes live in the Western Pacific region.
In 2015, 9.3 per cent (8.2-11.4 per cent ‡) of adults aged 20-79 are estimated to be living with diabetes.
This is equivalent to 153 (135-188‡) million people. Over half (52.1 per cent) of these are undiagnosed, 61.6 per cent live in cities and 90.2 per cent live in low- or middle-income countries. The Western Pacific Region is home to 36.9 per cent of the total number of people with diabetes in the world.
DIABETES | HEALTH EXPENDITURE

12 per cent of global health expenditure
$673 billion
Diabetes imposes a large economic burden on the national healthcare system. Healthcare expenditures on diabetes accounted for 11.6 per cent of the total healthcare expenditure in the world in 2010. About 95 per cent of the countries covered in this report were estimated to spend 5 per cent or more, and about 80 per cent of the countries were estimated to spend between 5 per cent and 13 per cent of their total healthcare dollars on diabetes.
Global health expenditures to prevent and treat diabetes and its complications were expected to total at least $376 billion in 2010. By 2030, this number will exceed some $490 billion. An average of $703 per person were estimated to be spent on diabetes in 2010 globally.
Health expenditure on diabetes in India
India, the country with the largest population of people living with diabetes, will spend an estimated $2.8 billion, or less than 1 per cent of the global total. The current expenditure on diabetes treatment in India is approximately $95 (Rs 6,000) person/annum as per the IDF atlas, 2014, whereas the cost of treatment of one complication of diabetes such as, treating the diabetic foot is around Rs 10,000 – 30,000 per treatment. With the huge number of diabetes patients and complications we are dealing with, overall health expenditure per person is much less as compared to the developed countries. An average of $7,383 per person with diabetes will be spent on diabetes-related care in the US but less than $10 per person will be spent in Burundi, Côte d’Ivoire and Myanmar.
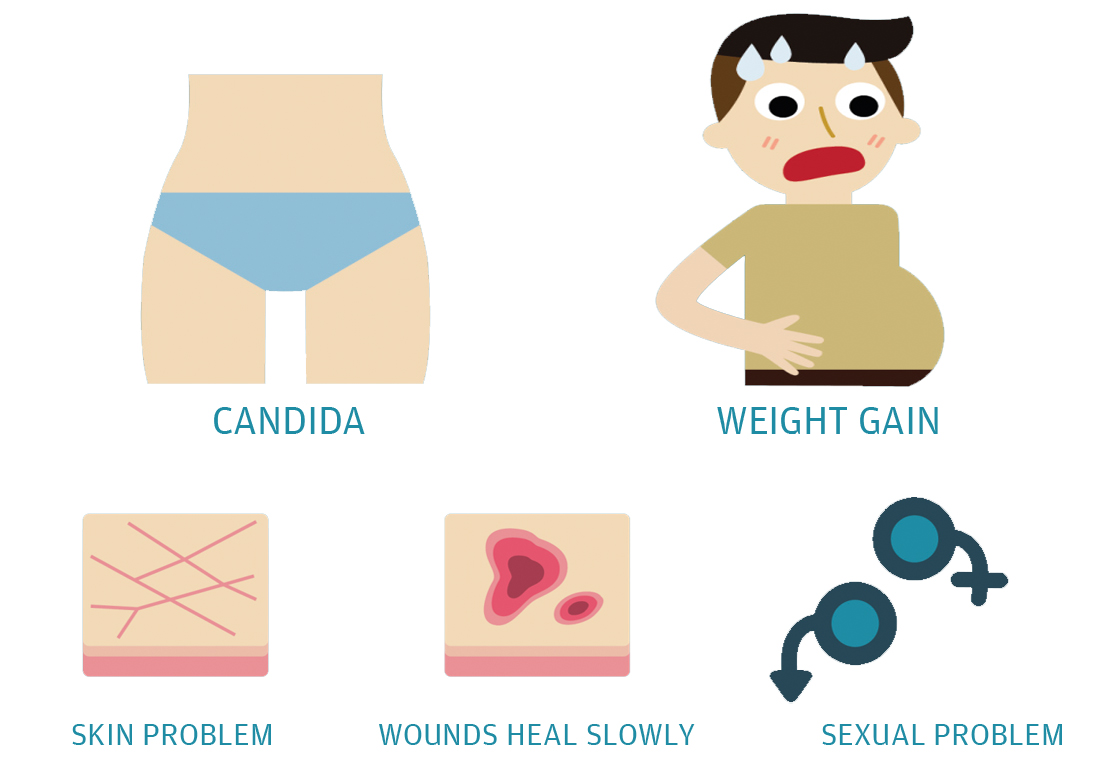
DIABETES | Symptoms & complications
How can you tell if you have diabetes? Most early symptoms are from higher-than-normal levels of glucose, a kind of sugar, in your blood. The warning signs can be so mild that you don’t notice them. That’s especially true of Type 2 diabetes. Some people don’t find out they have it until they get problems from long-term damage caused by the disease.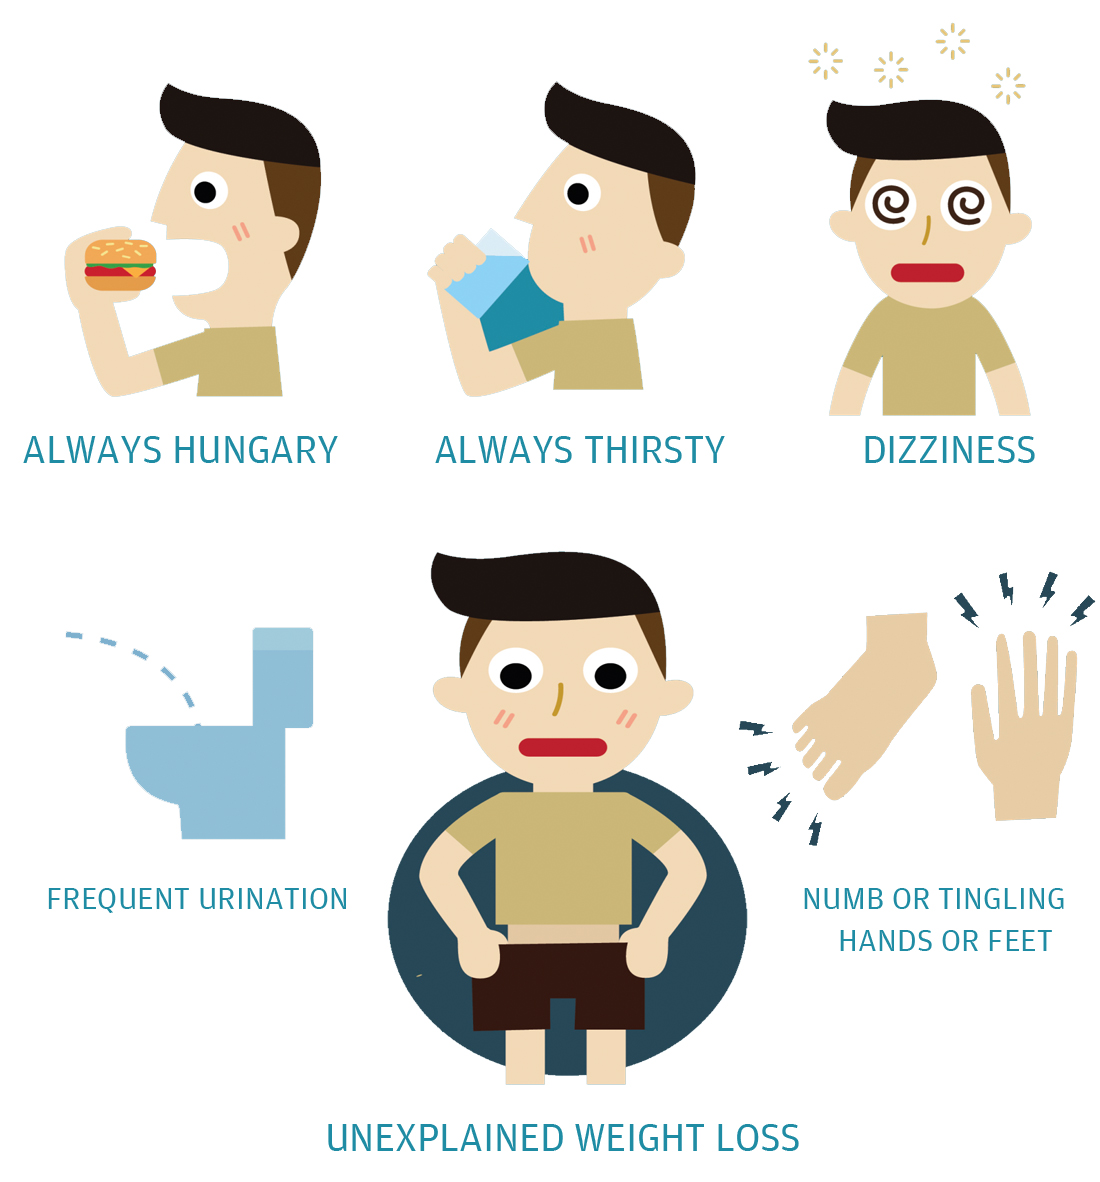
With Type 1 diabetes, the symptoms usually happen quickly, in a matter of days or a few weeks. They’re much more severe, too.
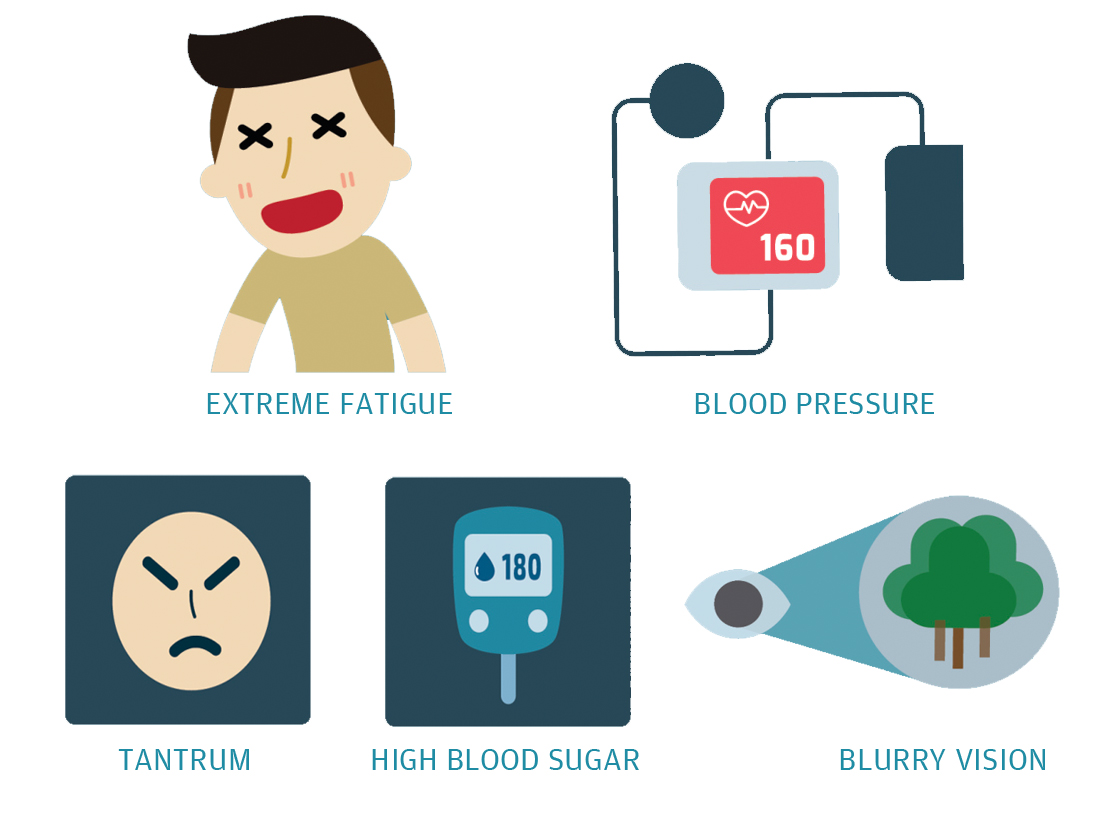
Other Type 1 symptoms
Nausea and vomiting. When your body resorts to burning fat, it makes “ketones.” These can build up in your blood to dangerous levels, a possibly life-threatening condition called diabetic ketoacidosis. Ketones can make you feel sick to your stomach.
Complications
Diabetes increases your risk for many serious health problems. What’s the good news? With correct treatment and recommended lifestyle changes, many people with diabetes are able to prevent or delay the onset of complications.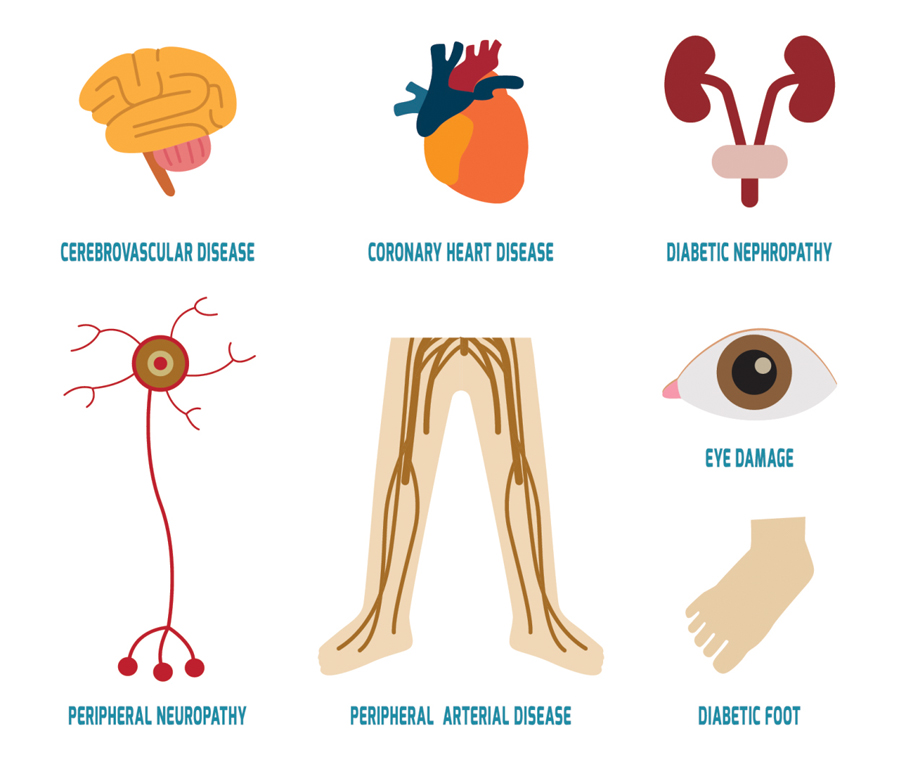
It’s hard to ignore the signs of Type 1 diabetes because symptoms can often appear quite quickly. But leaving it untreated can lead to serious health problems, including diabetic ketoacidosis, which can result in a potentially fatal coma.
Type 2 diabetes can be easier to miss as it develops more slowly, especially in the early stages when it can be harder to spot the symptoms. But untreated diabetes affects many major organs, including your heart, blood vessels, nerves, eyes and kidneys. Being diagnosed early and controlling your blood sugar levels can help prevent these complications
DIABETES | Prevention & solution

70 per cent
Diabetes could be prevented by healthy lifestyle.
Diabetes imposes a large economic burden on the national healthcare system. Healthcare expenditures on diabetes will account for 11.6 per cent of the total healthcare expenditure in the world in 2010. About 95 per cent of the countries covered in this report will spend 5 per cent or more, and about 80 per cent of the countries will spend between 5 per cent and 13 per cent of their total healthcare dollars on diabetes.
1. Maintain a healthy diet
The right meal plan will help you improve your blood glucose, blood pressure, and cholesterol numbers and also help keep your weight on track. Whether you need to lose weight or stay where you are, your meal plan can help.
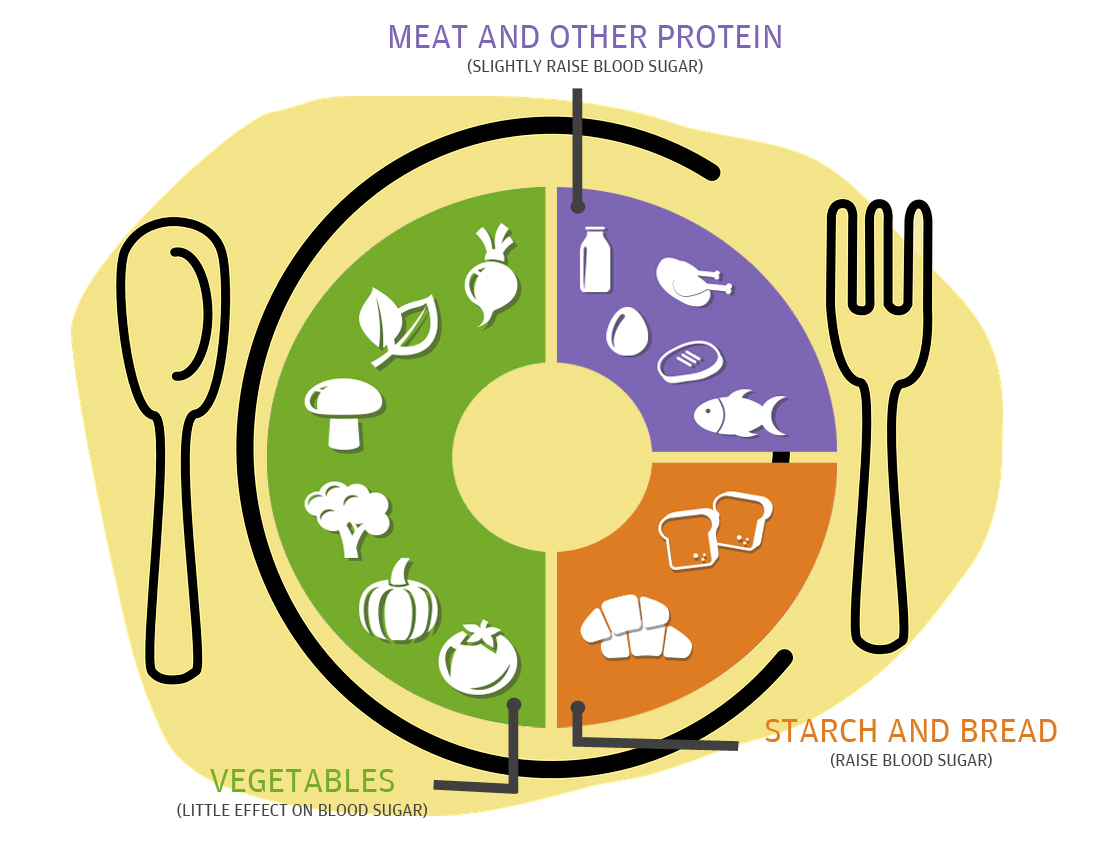 There is no one perfect food so including a variety of different foods and watching portion sizes is key to a healthy diet. Also, make sure your choices from each food group provide the highest quality nutrients you can find. In other words, pick foods rich in vitamins, minerals and fibre over those that are processed.
2. Quit your sedentary lifestyle
The incidence of Type 2 diabetes is rapidly increasing worldwide due to the increasing occurrence of obesity and sedentary lifestyle. Type 2 diabetes is no longer confined to middle-aged and elderly people, but is increasingly common among young people and even children. Type 2 diabetes constitutes a major health problem in both developed and developing countries, and with obesity, it is becoming one of the largest challenges to health care systems. Therefore, any measures to prevent or delay the development of diabetes are urgently needed.
 A February 2013 study published in the International Journal of Behavioral Nutrition and Physical Activity in surveyed 63,048 middle-aged Australian men about how long they sit during an average day as well as diagnoses of any chronic diseases, including Type 2 diabetes. The responses spanned from less than four hours to more than eight hours of sitting a day.
3. Keep weight under control
Physical activity is another important part of your diabetes management plan. When you exercise, your muscles use sugar (glucose) for energy. Regular physical activity also helps your body use insulin more efficiently.
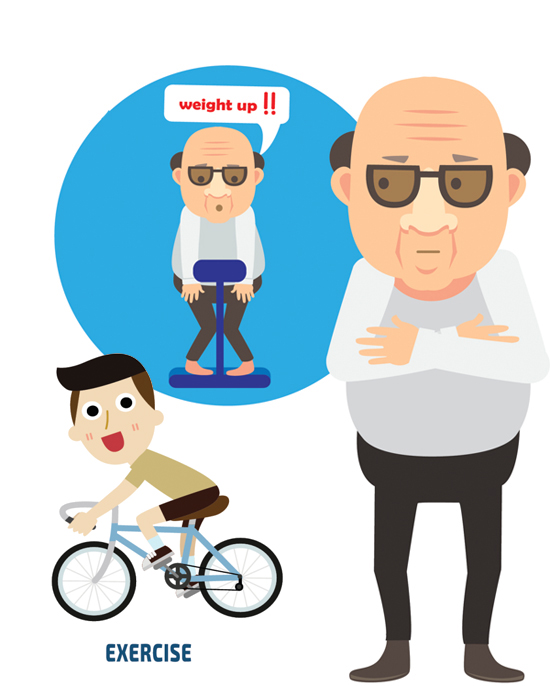 These factors work together to lower your blood sugar level. The more strenuous your workout, the longer the effect lasts. But even light activities — such as housework, gardening or being on your feet for extended periods — can improve your blood sugar level.
4. No smoking, no alcohol
People with diabetes who smoke have higher blood-sugar levels and less control over their blood-sugar levels than non-smokers with diabetes. Smoking affects circulation by increasing heart rate and blood pressure and by making small blood vessels narrower. Smoking also makes blood cells and blood-vessel walls sticky, and allows dangerous fatty material to build up. This can lead to heart attack, stroke and other blood vessel diseases.

Young adult smokers with diabetes are two to three times more likely to be sick than non-smokers with diabetes.
The liver normally releases stored sugar to counteract falling blood sugar levels. But if your liver is busy metabolising alcohol, your blood sugar level may not get the boost it needs from the liver. Alcohol can result in low blood sugar shortly after you drink it and for as many as 24 hours more.