By Categories: Society

Winter is coming – and it is DEMOGRAPHIC !!!

For most of their existence, hominids lived much like other animals. Over hundreds of thousands of years, their numbers were shaped by natural selection, with high birth rates matched by equally high death rates.

A decisive shift came with the emergence of Homo sapiens. We spread across the Earth, built the first permanent settlements, and learned to domesticate plants and animals. By the beginning of the Common Era, the world’s population is estimated to have been around 250 million.

It took nearly 1,600 years for our numbers to double to 500 million, a process further slowed by catastrophes such as the Black Death in the fourteenth century. After this, the pace of growth began to quicken. By 1804, our population reached one billion for the first time, reflecting the transformative effects of industrialisation, improved agriculture, and medical advances.

In 1798, the English economist Thomas Malthus presented his Essay on the principle of population. In it, he popularized the idea of the Malthusian trap (or Malthusian catastrophe), according to which he predicted that the population would continue to grow exponentially, doubling every 25 years, while resources would only grow arithmetically. This decoupling, according to Malthus’ theory, would cause continuous impoverishment of citizens, leading to the extinction of humanity by 1880.

Extinction did not occur in 1880; however, the human population continued to expand at an unusually rapid pace. In 1927, the population reached 2 billion, and in 1975, it reached 4 billion. Gladly, technological advances continued to improve food production, and medicine made it possible to effectively combat diseases that were previously incurable. However, the fear of overpopulation remained latent in society, and many organisations continued to warn of the great threat and its consequences.

The demographic transition: 

After analysing demographic changes in several countries following industrialisation, scientists such as Warren Thompson and Adolphe Landry began to propose a series of demographic theories that would eventually be formalised in the 1940s by Frank W. Notestein. This model is known as the theory of demographic transition.

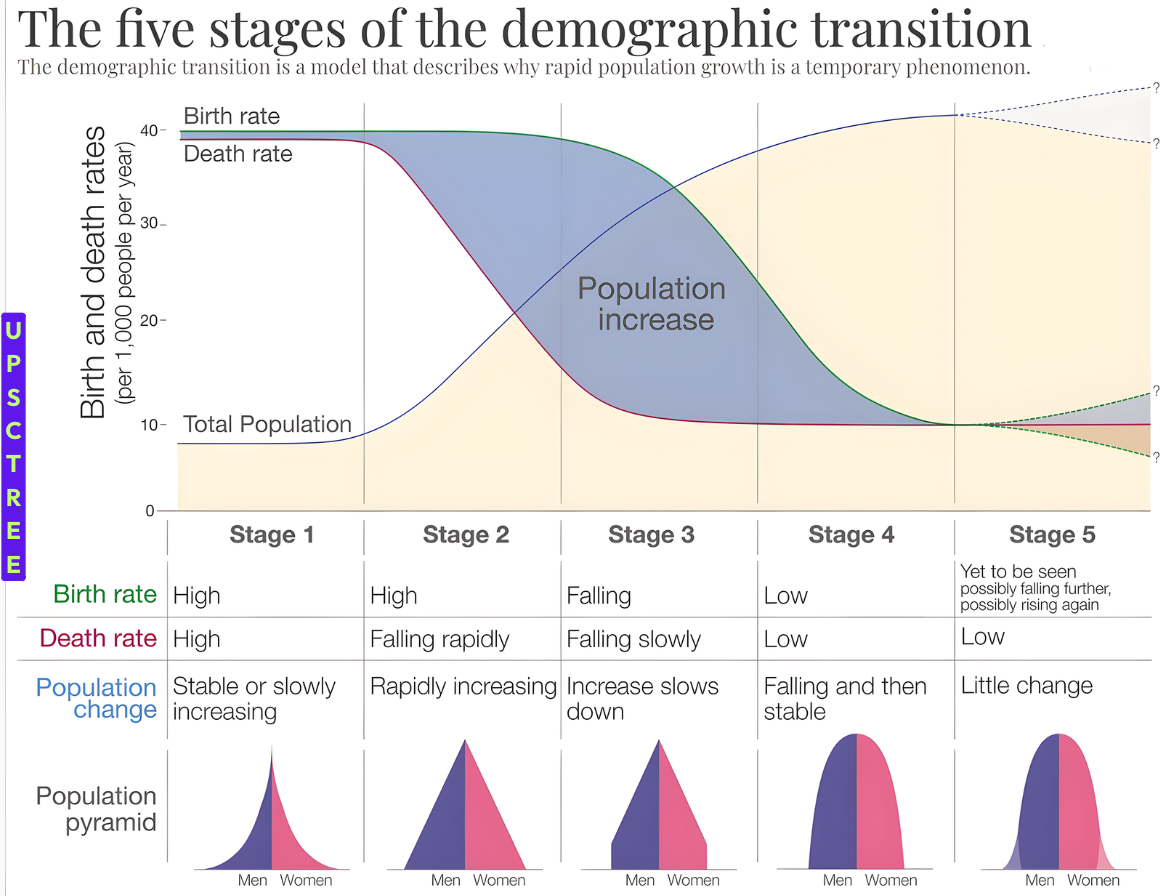
This model is based on a premise that can be verified with historical data: pre-industrial societies had very low growth rates, with very high birth and death rates. With industrialisation, societies moved from this paradigm to one of zero growth, in which both birth and death rates plummeted to record lows. The most interesting part of the model is how this transition occurs. The decline in mortality and birth rates occurs at different rates, allowing natural population growth (more births than deaths) to skyrocket during this period.

This model, which was initially created to explain industrialisation in the 19th and early 20th centuries, proved to be quite effective in modelling demographic changes throughout the 20th century. Industrialising societies experienced excessive growth, while those that had been industrialised for longer gradually stabilised their natural growth, bringing it closer to the equilibrium predicted by Notestein.

However, at the end of the 20th century, something began to happen that the model did not anticipate. There were countries whose natural growth did not remain at zero, but fell below the replacement rate.

The onset of demographic winter:

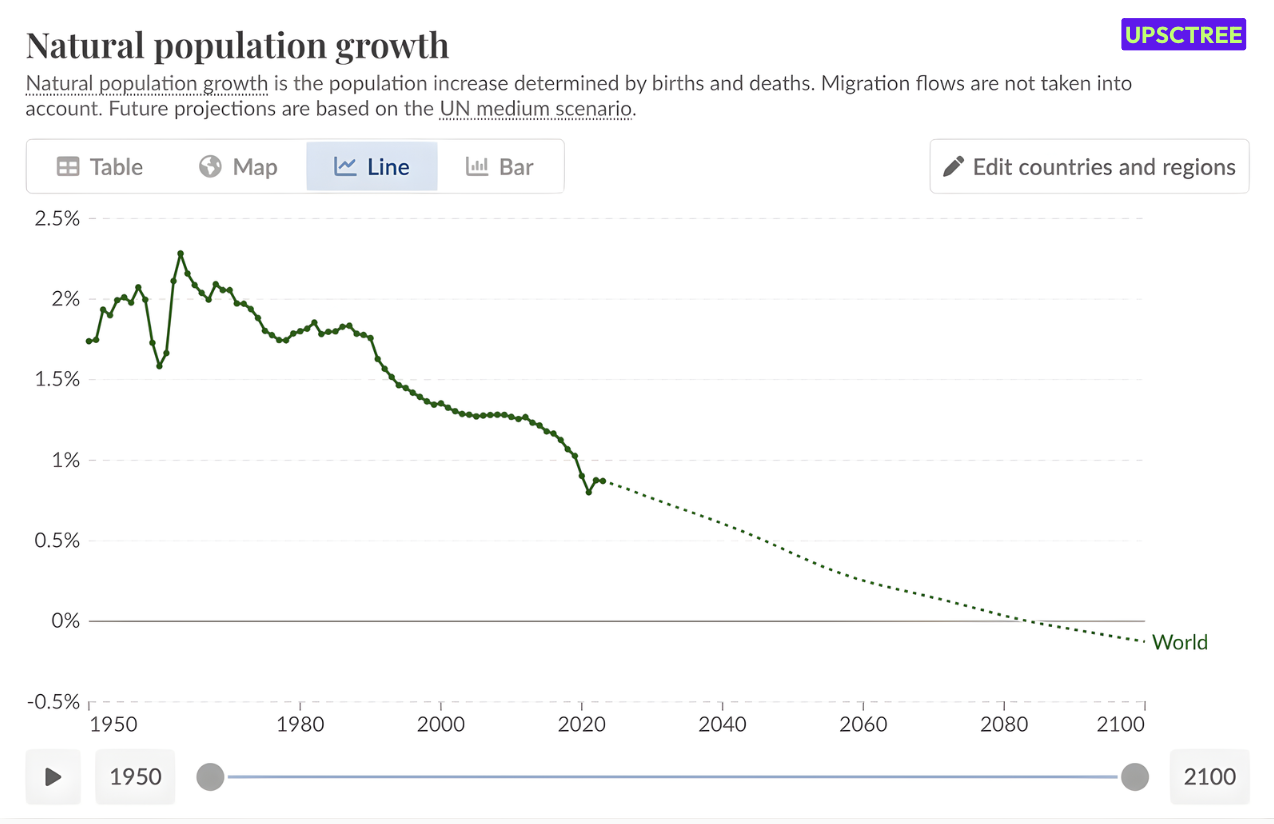
Although there are already many countries, mainly in Europe, with negative natural growth, where deaths outnumber births, there are still more countries where the opposite is true. Africa’s great engine continues to drive growth, but fertility rates continue to decline worldwide, at a much faster pace than expected.

r/overpopulation - World map of fertility rates by country; 1970 vs 2014
This comparative map shows how most of Africa had a fertility rate above 6 children in 1970, while in 2014 only Somalia, Mali, and Niger still met this criterion. In the Maghreb region, the figure has fallen below 3 in all countries in just half a century.

The UN has been revising its global population growth forecasts downwards for several years. In 2017, the estimate was that the global population would peak in 2100, with a total of 11.2 billion inhabitants. A couple of years ago, in 2022, this was revised downwards, with an estimated peak of 10.4 billion in 2084. Global population growth is declining, and zero growth will not be the end point of this demographic trend.

We are already seeing how negative population growth in many countries is being offset by migration flows, but this solution may have significant long-term consequences. Few countries currently function as magnets for migrants, but this number will grow.

China is already losing inhabitants, and fertility rates suggest that this decline will be very pronounced in the coming decades.

It will become increasingly common for countries in demographic decline to start competing for migrants from the few countries with positive natural growth.

From this perspective, demographic winter appears to be a plausible long-term outcome for humanity. While future medical, technological, or social transformations could fundamentally alter current trends, existing evidence makes it difficult to envisage a radically different trajectory.

Share is Caring, Choose Your Platform!

Recent Posts


  • In a diverse country like India, where each State is socially, culturally, economically, and politically distinct, measuring Governance becomes increasingly tricky. The Public Affairs Index (PAI 2021) is a scientifically rigorous, data-based framework that measures the quality of governance at the Sub-national level and ranks the States and Union Territories (UTs) of India on a Composite Index (CI).


    States are classified into two categories – Large and Small – using population as the criteria.

    In PAI 2021, PAC defined three significant pillars that embody GovernanceGrowth, Equity, and Sustainability. Each of the three Pillars is circumscribed by five governance praxis Themes.

    The themes include – Voice and Accountability, Government Effectiveness, Rule of Law, Regulatory Quality and Control of Corruption.

    At the bottom of the pyramid, 43 component indicators are mapped to 14 Sustainable Development Goals (SDGs) that are relevant to the States and UTs.

    This forms the foundation of the conceptual framework of PAI 2021. The choice of the 43 indicators that go into the calculation of the CI were dictated by the objective of uncovering the complexity and multidimensional character of development governance

    The Equity Principle

    The Equity Pillar of the PAI 2021 Index analyses the inclusiveness impact at the Sub-national level in the country; inclusiveness in terms of the welfare of a society that depends primarily on establishing that all people feel that they have a say in the governance and are not excluded from the mainstream policy framework.

    This requires all individuals and communities, but particularly the most vulnerable, to have an opportunity to improve or maintain their wellbeing. This chapter of PAI 2021 reflects the performance of States and UTs during the pandemic and questions the governance infrastructure in the country, analysing the effectiveness of schemes and the general livelihood of the people in terms of Equity.

    Growth and its Discontents

    Growth in its multidimensional form encompasses the essence of access to and the availability and optimal utilisation of resources. By resources, PAI 2021 refer to human resources, infrastructure and the budgetary allocations. Capacity building of an economy cannot take place if all the key players of growth do not drive development. The multiplier effects of better health care, improved educational outcomes, increased capital accumulation and lower unemployment levels contribute magnificently in the growth and development of the States.

    The Pursuit Of Sustainability

    The Sustainability Pillar analyses the access to and usage of resources that has an impact on environment, economy and humankind. The Pillar subsumes two themes and uses seven indicators to measure the effectiveness of government efforts with regards to Sustainability.


    The Curious Case Of The Delta

    The Delta Analysis presents the results on the State performance on year-on-year improvement. The rankings are measured as the Delta value over the last five to 10 years of data available for 12 Key Development Indicators (KDI). In PAI 2021, 12 indicators across the three Pillars of Equity (five indicators), Growth (five indicators) and Sustainability (two indicators). These KDIs are the outcome indicators crucial to assess Human Development. The Performance in the Delta Analysis is then compared to the Overall PAI 2021 Index.

    Key Findings:-

    1. In the Large States category (overall), Chhattisgarh ranks 1st, followed by Odisha and Telangana, whereas, towards the bottom are Maharashtra at 16th, Assam at 17th and Gujarat at 18th. Gujarat is one State that has seen startling performance ranking 5th in the PAI 2021 Index outperforming traditionally good performing States like Andhra Pradesh and Karnataka, but ranks last in terms of Delta
    2. In the Small States category (overall), Nagaland tops, followed by Mizoram and Tripura. Towards the tail end of the overall Delta ranking is Uttarakhand (9th), Arunachal Pradesh (10th) and Meghalaya (11th). Nagaland despite being a poor performer in the PAI 2021 Index has come out to be the top performer in Delta, similarly, Mizoram’s performance in Delta is also reflected in it’s ranking in the PAI 2021 Index
    3. In terms of Equity, in the Large States category, Chhattisgarh has the best Delta rate on Equity indicators, this is also reflected in the performance of Chhattisgarh in the Equity Pillar where it ranks 4th. Following Chhattisgarh is Odisha ranking 2nd in Delta-Equity ranking, but ranks 17th in the Equity Pillar of PAI 2021. Telangana ranks 3rd in Delta-Equity ranking even though it is not a top performer in this Pillar in the overall PAI 2021 Index. Jharkhand (16th), Uttar Pradesh (17th) and Assam (18th) rank at the bottom with Uttar Pradesh’s performance in line with the PAI 2021 Index
    4. Odisha and Nagaland have shown the best year-on-year improvement under 12 Key Development indicators.

    In the Scheme of Things

    The Scheme Analysis adds an additional dimension to ranking of the States on their governance. It attempts to complement the Governance Model by trying to understand the developmental activities undertaken by State Governments in the form of schemes. It also tries to understand whether better performance of States in schemes reflect in better governance.

    The Centrally Sponsored schemes that were analysed are National Health Mission (NHM), Umbrella Integrated Child Development Services scheme (ICDS), Mahatma Gandh National Rural Employment Guarantee Scheme (MGNREGS), Samagra Shiksha Abhiyan (SmSA) and MidDay Meal Scheme (MDMS).

    National Health Mission (NHM)

    • In the 60:40 division States, the top three performers are Kerala, Goa and Tamil Nadu and, the bottom three performers are Uttar Pradesh, Jharkhand and Bihar.
    • In the 90:10 division States, the top three performers were Himachal Pradesh, Sikkim and Mizoram; and, the bottom three performers are Manipur, Assam and Meghalaya.


    INTEGRATED CHILD DEVELOPMENT SERVICES (ICDS)

    • Among the 60:40 division States, Orissa, Chhattisgarh and Madhya Pradesh are the top three performers and Tamil Nadu, Telangana and Delhi appear as the bottom three performers.
    • Among the 90:10 division States, the top three performers are Manipur, Arunachal Pradesh and Nagaland; and, the bottom three performers are Jammu and Kashmir, Uttarakhand and Himachal Pradesh


    MID- DAY MEAL SCHEME (MDMS)

    • Among the 60:40 division States, Goa, West Bengal and Delhi appear as the top three performers and Andhra Pradesh, Telangana and Bihar appear as the bottom three performers.
    • Among the 90:10 division States, Mizoram, Himachal Pradesh and Tripura were the top three performers and Jammu & Kashmir, Nagaland and Arunachal Pradesh were the bottom three performers


    SAMAGRA SHIKSHA ABHIYAN (SMSA)

    • West Bengal, Bihar and Tamil Nadu were the top three States amongst the 60:40 division States; while Haryana, Punjab and Rajasthan appeared as the bottom three performers
    • In the case of 90:10 division States, Mizoram, Assam and Tripura were the top three performers and Nagaland, Jammu & Kashmir and Uttarakhand featured as the bottom three


    MAHATMA GANDHI NATIONAL RURAL EMPLOYMENT GUARANTEE SCHEME (MGNREGS)

    • Among the 60:40 division States, the top three performers are Kerala, Andhra Pradesh and Orissa and the bottom three performers are Madhya Pradesh, Jharkhand and Goa
    • In the 90:10 division States, the top three performers are Mizoram, Sikkim and Nagaland and the bottom three performers are Manipur and Assam