The latest Global Peace Index report, released recently, finds that 2015 was a bad year for international peace and security. It recorded a further deterioration in global peace based on historic trends.
2015 witnessed the highest number of global battle deaths for 25 years, persistently high levels of terrorism, and the highest number of refugees and displaced people since World War II.
This violence had a huge cost. The report finds that the economic impact of violence to the global economy was $13.6 trillion in 2015 in terms of purchasing power parity (PPP). This is equivalent to $5 per day for every person on the planet, or 11 times the size of global foreign direct investment (FDI).

The toll of violence is typically counted in terms of its human and emotional cost, but the financial damage to the economy is yet another additional factor to consider.
When counting the economic impact one must look at the costs of preventing and containing violence, as well as measuring its consequences. This is important because spending on containing violence, while perhaps necessary, is fundamentally economically unproductive.
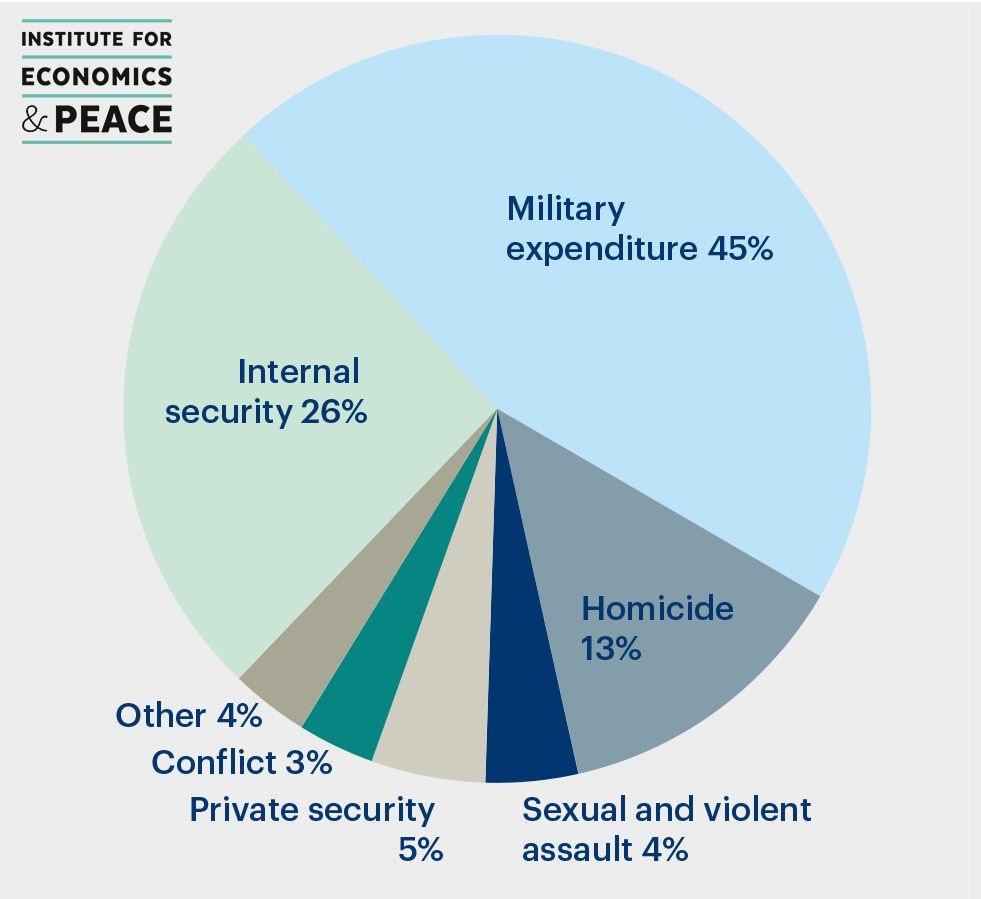
The costs of war:-
The $13.6 trillion of expenditures and losses represent 13.3% of world GDP. To break this figure down, it’s the equivalent of $1,876 for every person on the planet.
The numbers refer to the current expenditures and their estimated flow-on effects in 2015, and are represented in PPP international dollars.
These numbers are notable for two reasons:-
Firstly, over 70% of the economic impact of violence accrues from what is mostly government spending on the military and internal security. This shows that significant amounts of government expenditure are tied up to this end. In a perfectly peaceful world, these huge resources could be directed elsewhere.
Secondly, the remaining amount is consequential losses from violence and conflict and these, too, are enormous. They significantly outweigh the international community’s spending on building peace.

A quick examination of the numbers reveals that the world continues to spend vastly disproportionate resources on creating and containing violence compared to what it spends on peace.
In 2015 alone, UN peacekeeping expenditures of $8.27 billion totalled only 1.1% of the estimated $742 billion of economic losses from armed conflict.
Fundamental to future improvements in peace is a greater investment in peace-building and peace-keeping. Peace-keeping operations are measures aimed at responding to a conflict, whereas peace-building expenditures are aimed at developing and maintaining the capacities for resilience to conflict.
Peace-building expenditure aims to reduce the risk of lapsing or relapsing into violent conflict by strengthening national capacities and institutions for conflict management and laying the foundations of sustainable peace and development.
These numbers suggest a serious under-investment in the activities that build peace and demonstrate that the international community is spending too much on conflict and too little on peace. Given the fact that the cost of violence is so significant, the economic argument for more spending on peace is indeed powerful.
The rise of peace inequality
Furthermore, a new phenomenon is emerging as some countries grow more peaceful while overall levels of violence increase: peace inequality. This drives a broader dynamic of greater economic inequalities between nations; as the least peaceful countries spiral into greater violence and conflict, they are also further set back economically.
Recent Posts
- In the Large States category (overall), Chhattisgarh ranks 1st, followed by Odisha and Telangana, whereas, towards the bottom are Maharashtra at 16th, Assam at 17th and Gujarat at 18th. Gujarat is one State that has seen startling performance ranking 5th in the PAI 2021 Index outperforming traditionally good performing States like Andhra Pradesh and Karnataka, but ranks last in terms of Delta
- In the Small States category (overall), Nagaland tops, followed by Mizoram and Tripura. Towards the tail end of the overall Delta ranking is Uttarakhand (9th), Arunachal Pradesh (10th) and Meghalaya (11th). Nagaland despite being a poor performer in the PAI 2021 Index has come out to be the top performer in Delta, similarly, Mizoram’s performance in Delta is also reflected in it’s ranking in the PAI 2021 Index
- In terms of Equity, in the Large States category, Chhattisgarh has the best Delta rate on Equity indicators, this is also reflected in the performance of Chhattisgarh in the Equity Pillar where it ranks 4th. Following Chhattisgarh is Odisha ranking 2nd in Delta-Equity ranking, but ranks 17th in the Equity Pillar of PAI 2021. Telangana ranks 3rd in Delta-Equity ranking even though it is not a top performer in this Pillar in the overall PAI 2021 Index. Jharkhand (16th), Uttar Pradesh (17th) and Assam (18th) rank at the bottom with Uttar Pradesh’s performance in line with the PAI 2021 Index
- Odisha and Nagaland have shown the best year-on-year improvement under 12 Key Development indicators.
- In the 60:40 division States, the top three performers are Kerala, Goa and Tamil Nadu and, the bottom three performers are Uttar Pradesh, Jharkhand and Bihar.
- In the 90:10 division States, the top three performers were Himachal Pradesh, Sikkim and Mizoram; and, the bottom three performers are Manipur, Assam and Meghalaya.
- Among the 60:40 division States, Orissa, Chhattisgarh and Madhya Pradesh are the top three performers and Tamil Nadu, Telangana and Delhi appear as the bottom three performers.
- Among the 90:10 division States, the top three performers are Manipur, Arunachal Pradesh and Nagaland; and, the bottom three performers are Jammu and Kashmir, Uttarakhand and Himachal Pradesh
- Among the 60:40 division States, Goa, West Bengal and Delhi appear as the top three performers and Andhra Pradesh, Telangana and Bihar appear as the bottom three performers.
- Among the 90:10 division States, Mizoram, Himachal Pradesh and Tripura were the top three performers and Jammu & Kashmir, Nagaland and Arunachal Pradesh were the bottom three performers
- West Bengal, Bihar and Tamil Nadu were the top three States amongst the 60:40 division States; while Haryana, Punjab and Rajasthan appeared as the bottom three performers
- In the case of 90:10 division States, Mizoram, Assam and Tripura were the top three performers and Nagaland, Jammu & Kashmir and Uttarakhand featured as the bottom three
- Among the 60:40 division States, the top three performers are Kerala, Andhra Pradesh and Orissa and the bottom three performers are Madhya Pradesh, Jharkhand and Goa
- In the 90:10 division States, the top three performers are Mizoram, Sikkim and Nagaland and the bottom three performers are Manipur and Assam
In a diverse country like India, where each State is socially, culturally, economically, and politically distinct, measuring Governance becomes increasingly tricky. The Public Affairs Index (PAI 2021) is a scientifically rigorous, data-based framework that measures the quality of governance at the Sub-national level and ranks the States and Union Territories (UTs) of India on a Composite Index (CI).
States are classified into two categories – Large and Small – using population as the criteria.
In PAI 2021, PAC defined three significant pillars that embody Governance – Growth, Equity, and Sustainability. Each of the three Pillars is circumscribed by five governance praxis Themes.
The themes include – Voice and Accountability, Government Effectiveness, Rule of Law, Regulatory Quality and Control of Corruption.
At the bottom of the pyramid, 43 component indicators are mapped to 14 Sustainable Development Goals (SDGs) that are relevant to the States and UTs.
This forms the foundation of the conceptual framework of PAI 2021. The choice of the 43 indicators that go into the calculation of the CI were dictated by the objective of uncovering the complexity and multidimensional character of development governance
The Equity Principle
The Equity Pillar of the PAI 2021 Index analyses the inclusiveness impact at the Sub-national level in the country; inclusiveness in terms of the welfare of a society that depends primarily on establishing that all people feel that they have a say in the governance and are not excluded from the mainstream policy framework.
This requires all individuals and communities, but particularly the most vulnerable, to have an opportunity to improve or maintain their wellbeing. This chapter of PAI 2021 reflects the performance of States and UTs during the pandemic and questions the governance infrastructure in the country, analysing the effectiveness of schemes and the general livelihood of the people in terms of Equity.
Growth and its Discontents
Growth in its multidimensional form encompasses the essence of access to and the availability and optimal utilisation of resources. By resources, PAI 2021 refer to human resources, infrastructure and the budgetary allocations. Capacity building of an economy cannot take place if all the key players of growth do not drive development. The multiplier effects of better health care, improved educational outcomes, increased capital accumulation and lower unemployment levels contribute magnificently in the growth and development of the States.
The Pursuit Of Sustainability
The Sustainability Pillar analyses the access to and usage of resources that has an impact on environment, economy and humankind. The Pillar subsumes two themes and uses seven indicators to measure the effectiveness of government efforts with regards to Sustainability.
The Curious Case Of The Delta
The Delta Analysis presents the results on the State performance on year-on-year improvement. The rankings are measured as the Delta value over the last five to 10 years of data available for 12 Key Development Indicators (KDI). In PAI 2021, 12 indicators across the three Pillars of Equity (five indicators), Growth (five indicators) and Sustainability (two indicators). These KDIs are the outcome indicators crucial to assess Human Development. The Performance in the Delta Analysis is then compared to the Overall PAI 2021 Index.
Key Findings:-
In the Scheme of Things
The Scheme Analysis adds an additional dimension to ranking of the States on their governance. It attempts to complement the Governance Model by trying to understand the developmental activities undertaken by State Governments in the form of schemes. It also tries to understand whether better performance of States in schemes reflect in better governance.
The Centrally Sponsored schemes that were analysed are National Health Mission (NHM), Umbrella Integrated Child Development Services scheme (ICDS), Mahatma Gandh National Rural Employment Guarantee Scheme (MGNREGS), Samagra Shiksha Abhiyan (SmSA) and MidDay Meal Scheme (MDMS).
National Health Mission (NHM)
INTEGRATED CHILD DEVELOPMENT SERVICES (ICDS)
MID- DAY MEAL SCHEME (MDMS)
SAMAGRA SHIKSHA ABHIYAN (SMSA)
MAHATMA GANDHI NATIONAL RURAL EMPLOYMENT GUARANTEE SCHEME (MGNREGS)