National Hydrology Project:-
Background :-The Union Cabinet chaired by the Prime Minister has given its approval to Implementation of the National Hydrology Project.The National Hydrology Project (NHP) is intended for setting up of a system for timely and reliable water resources data acquisition, storage, collation and management. It will also provide tools/systems for informed decision making through Decision Support Systems (DSS) for water resources assessment, flood management, reservoir operations, drought management, etc. NHP also seeks to build capacity of the State and Central sector organisations in water resources management through the use of Information Systems and adoption of State-of-the-art technologies like Remote Sensing.
Details:-
The NHP will help in gathering Hydro-meteorological data which will be stored and analysed on a real time basis and can be seamlessly accessed by any user at the State/District/village level. The project envisages to cover the entire country as the earlier hydrology projects covered only 13 States.
The components of the proposal are:
- In Situ Hydromet Monitoring System and Hydromet Data Acquisition System.
- Setting up of National Water Informatics Centre (NWIC).
- Water Resources Operation and Management System
- Water Resources Institutions and Capacity Building
The NHP will result in the improvement of:
- Data storage, exchange, analysis and dissemination through National Water Informatics Centre.
- Lead time in flood forecast from 1 day to at least 3 days
- Mapping of flood inundation areas for use by the disaster management authorities
- Assessment of surface and ground water resources in a river basin for better planning & allocation for PMKSY and other schemes of Govt. of India
- Reservoir operations through seasonal yield forecast, drought management, SCADA systems, etc.
- Design of SW & GW structures, hydropower units, interlinking of rivers, Smart Cities.
- Fulfilling the objectives of Digital India.
- People Centric approach: The programme envisages ultimate aim for water management through scientific data collection, dissemination of information on water availability in all blocks of the country and establishing of National Water Information Centre. The automated systems for Flood Forecasting is aimed to reduce water disaster ultimately helping vulnerable population. It is people and farmer centric programme as information on water can help in predicting water availability and help farmers to plan their crops and other farm related activities. Through this programme India would make a place among nations known for scientific endeavors.
Different names of New year :-
Background :- Presidents of India’s greeting.
- Ugadi – Celebrated in Andhra Pradesh, telengana, Karnataka
- Gudi Padva:- Celebrated in Maharastra
- Chaitra Sukladi – North India
- Cheti Chand – Sindh region of India and Pakistan
- Navreh – Kashmir
- Sajibu Cheiraoba – Manipur
- Thapna – Rajasthan
Terrorism is on the rise – but there’s a bigger threat we’re not talking about
Note :- Data are given for understanding purpose only and except few not much of the data can be helpful from exam point of view.Hence, read with due care.
High-profile attacks on major cities in Belgium, France and the United States have set the world on edge. Commentators are talking of a new kind of protracted guerrilla war stretching from the Americas and Europe across Africa, Asia and the Arab world. This one is irregular, hybrid and networked, involving a constellation of terrorist organizations such as ISIS and Al Qaeda. Rather than hitting specific groups of people or symbolic sites, cities themselves are coming under siege. Complicating matters, violent extremists are recruiting directly from poorer and marginal neighbourhoods across the West.
The extent of local recruitment and so-called “extremist travelling” from Western countries is certainly cause for concern. One study estimates that as many as 31,000 people from 86 countries have made the trip to Iraq or Syria to join ISIS or other extremist groups since June 2014. It is not just Western Europe or North America that is proving to be fertile ground for so-called remote radicalization, but also Russia and Central Asia. Many foreign fighters are killed while fighting abroad, but as many as 30% of them eventually make the trip back home. Politicians are scrambling to respond and hate crimes against minority groups are on the rise.
It is statistically undeniable that terrorist violence is on the rise. But is today’s terrorist violence really more intense and widespread than in, say, the 1960s and 1970s? Are Western European and North American cities really the new front line of a global jihad? The answer partly depends on how terrorism is defined. There is currently no international legal or even academic agreement on what constitutes terrorism. Some experts say that it consists of violence perpetrated by non-state actors against civilians to achieve political religious or ideological change, but that sounds a lot like armed conflict. Complicating matters, governments routinely conflate terrorism and insurgency.

One way to better map out the extent of the terrorist threat is to follow the data. Notwithstanding serious challenges related to the quality and coverage of statistics on terrorism, warfare and homicide, it is possible to detect trends and patterns by honing in on the prevalence of lethal violence.
A not-so global jihad
It turns out that extremist violence is much less pervasive than you might think. As other analysts have noted, it is significantly more prolific outside Western countries than in them. A recent assessment of terrorist risks in 1,300 cities ranked urban centres in Afghanistan, Iraq, Libya, Nigeria, Pakistan and Somalia as significantly more vulnerable than those in Belgium, France, the UK or the US. At least 65 cities were described as facing extreme risk, with Iraq – especially Baghdad, Mosul, Al Ramadi, Ba´qubah, Kirkuk and Al Hillah – fielding six of the top 10. Consider that between 2000 and 2014, there were around 3,659 terrorist-related deaths in all Western countries combined. In Baghdad there were 1,141 deaths and 3,654 wounded in 2014 alone.
It is true that there have been dozens of terrorist attacks in recent years, but how are they spread around the world? The Global Terrorism Database (GTD) tracks terrorist-related fatalities between 2005 and 2014 in 160 countries. In a handful of cases where there is ongoing warfare – including Afghanistan, Iraq, Syria and Yemen – the GTD sometimes conflates terrorist and conflict-related deaths. The authors of the database go to great lengths to avoid this from happening, but it is unavoidable. There are alternative datasets that apply much more restrictive inclusion criteria, but they are not as broad in their coverage and also suffer flaws. Rather than focusing on absolute numbers of violent deaths, it may be more useful to consider prevalence rates.
On the one hand, most countries at the top of the list of most terrorism-prone are clustered in North Africa, the Middle East and South Asia. They include war-torn countries such as Iraq, Afghanistan, Somalia, Libya, the Occupied Palestinian Territories, Lebanon, Israel, Yemen, Pakistan and Syria. Other countries in the top 15 are more unexpected, not least the Former Yugoslavian Republic of Macedonia, Central African Republic, and Kenya. Belgium comes in at 86th place while France and the United States come in at 98th and 105th respectively. These latter rankings will obviously shift upwards given recent attacks in 2015 and 2016, but not by as much as you might expect.

Note: Fatalities are classified as terrorist-related if the action occurs outside the context of legitimate warfare activities, insofar as it targets non‐combatants as expressed by international humanitarian law.
Victims of war
Innocent civilians are much more likely to be killed during the course of armed conflicts. The difference between the two is that terrorism is intended specifically to indiscriminately kill civilians, while in wars the killing of innocent civilians and prisoners is expressly prohibited, even if it does occur. War-related killings may be labelled criminal or even terrorist when they are determined to be disproportionate. So how does the risk rating of violent deaths occurring in war zones compare to those due to terrorism? The Uppsala Conflict Database Program records conflict deaths occurring in more than 60 wars between 2005 and 2014. After adjusting the absolute numbers of violent deaths relative to the total population per country, it is possible to determine an approximate conflict death rate per 100,000 people.
It turns out that the risk of dying violently from war is considerable higher than the probability of being killed in the course of extremist violence. Although in some countries this risk is an order of magnitude higher, the overall conflict death rate in conflict zones is still far lower than many might have predicted. For example, the average conflict death rate is sky-high in Syria – site of some of the most horrific warfare over the past decade. But it is comparatively lower in places like Afghanistan, Iraq, Libya, South Sudan, Chad and Yemen, countries that have been exposed to industrial-scale violence. The conflict death rate of course varies according to the ebb and flow of warfare, but the average prevalence is surprisingly low.

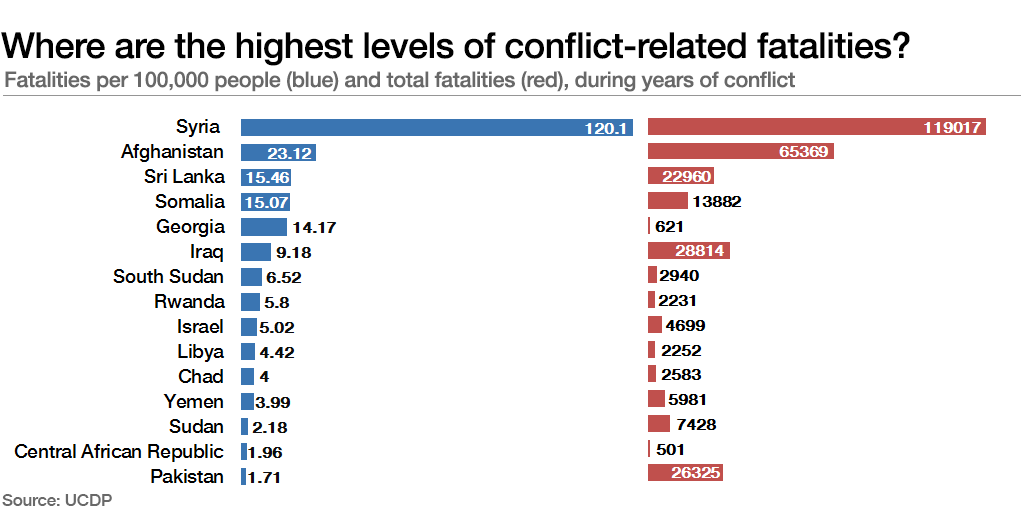
Note: Conflict deaths are defined as “battle deaths” caused by warring parties that can be directly attributed to combat. This includes traditional battlefield fighting, guerrilla activity, bombardment of bases and other actions where the target are military forces or representatives of the parties. Collateral damage, including civilian deaths, are counted.
The greatest threat of all: homicide
And now for the most surprising finding of all. A review of the data reveals that civilians around the world are much more at risk of being killed as result of homicide than either terrorist violence or warfare. Drawing on the Homicide Monitor, it is possible to track murder rates for more than 225 countries and territories from 2005 to 2014.
Although homicidal violence is steadily declining in most parts of the world, it still presents one of the greatest threats of what public health experts call external causes of mortality – especially among young adult and adolescent males.
As in the case of terrorist and conflict-related violence, there are also hot spots where murder tends to concentrate. People living in Central and South America, the Caribbean and Southern Africa are more at risk of dying of homicide than in most other places. The most murderous countries in the world include El Salvador, Honduras, Jamaica, Venezuela, the US Virgin Islands, Guatemala, Saint Kitts and Nevis, Belize, Colombia, Trinidad and Tobago, and Brazil. About 46 of the 50 most violent cities are concentrated in the Americas. Also included in the top 15 most murderous countries, though located outside the Americas, are South Africa, Swaziland and the Democratic Republic of Congo.
And beyond these pockets of extreme homicidal violence, the risk of murder is also more widely distributed than violent deaths associated with terrorism or war. There are roughly 85 countries that are consistently above the global average of around seven homicides per 100,000 people. In fact, about nine in every 10 violent deaths occurring around the world over the past decade were due to murder; just a fraction can be attributed to either war or terrorism. This is not to minimize the real dangers and destruction associated with these latter phenomena, but rather to ensure that we keep our eye firmly on the ball.

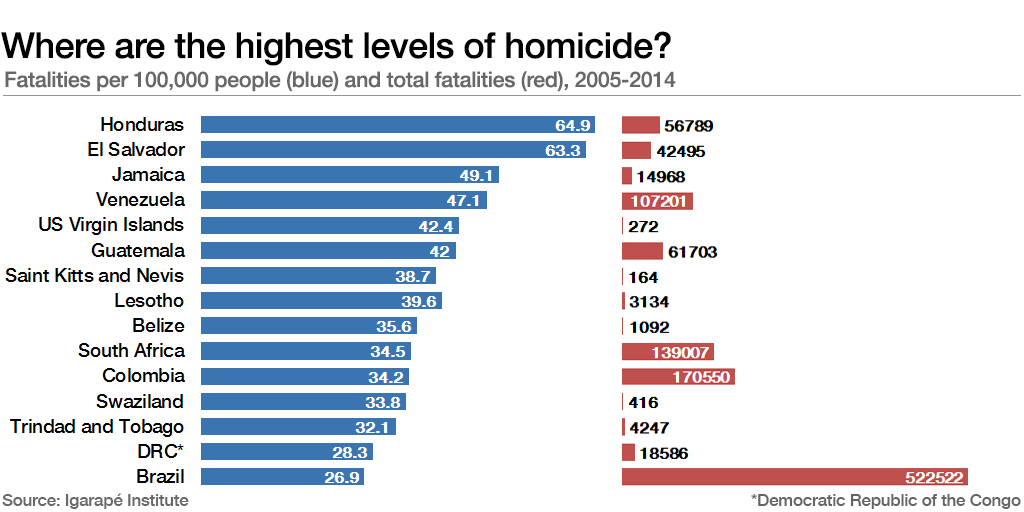
Note: Homicides are defined as the deliberate and unlawful killing of one person by another and are registered by police and health departments.
Drawing lessons from the data
So what does this morbid retreat into the data of violent death tell us? First, it is a reminder that a relatively small number of countries are dramatically more at risk of terrorist and conflict-related violence than others – especially Afghanistan, Iraq, Libya, Nigeria, Pakistan, Somalia, Syria and Yemen. While they must protect their homeland from terrorist events, diplomats, development experts and defence specialists would do well to double down on preventive diplomacy and conflict prevention in the most badly affected countries. Doing so could have a dramatic effect on reducing the global burden of terrorist and conflict violence and related humanitarian consequences such as refugee flows and internal population displacement.
Second, there are also a handful of countries – most of them in Latin America and the Caribbean – where homicidal violence is off-the charts. Most of the murders in these states are concentrated in fast-growing large- and medium-sized cities. If homicides are to be reduced there, it is essential that federal and municipal planners focus on risk factors that are driving urban violence – not least social and economic inequality, high rates of youth unemployment, poor and uneven governance, and the limited purchase of the rule of law. There is mounting evidence of data-driven strategies that work – including focused-deterrence, cognitive therapy and targeted prevention, but they need sustained leadership to have lasting effect.
Finally, we need to get better at nurturing resilience – the ability to cope, adapt and rebound in the face of adversity – in high-risk communities. While obviously distinct in their causes and consequences, there are still many commonalities connecting terrorist, conflict and homicidal violence. When communities are disorganized and suffer from neglect, there is a higher likelihood of politically, criminally and ideologically motivated organized violence erupting. Governments, businesses and civil society groups need to make sure that political settlements are inclusive, that marginalized groups and broken families are taken care of, and that resilience is designed in to communities from the get-go
ISBN Portal
The centre has launched a portal for registration and allotment of International Standard Book Number (ISBN).The ISBN portal is a part of central government’s e-governance initiative for streamlining the process of registration for publishers and authors which will make the process user friendly.This initiative is aimed at ensuring ease of registration, enhanced accessibility, wider transparency, trust and credibility and greater efficiency for the book writing fraternity in the country.
- The portal has been created to facilitate publishers and authors to register for ISBN number. ISBN gives an identity to a book without which the bookshops will not sell it.
- The ISBN portal seeks to completely automate the process of seeking application, their examination and allotment of ISBNs. The developed software has several modules including users’ registration and online application submission.
- The automation process also seeks to maintain inventory as well as process the data that will be provided by the users. There will be doing away with receipt of hard copy of any document unless considered appropriate for establishing the identity of the applicant and for confirming the book publishing activity.
ISBN :-
ISBN is a unique number used to identify monographic publications. Displayed in barcode format, ISBN is a 13-character identification allotted by the International ISBN Agency based in Britain through the National ISBN Agency. It provides access to bibliographic data bases used by the book industry and libraries to provide information.
Cabinet approves recommendations of 14th Finance Commissio:-
The Cabinet has approved the 14th Finance Commission’s recommendations on fiscal deficit targets and additional targets for states during 2015-20.
Key details:-
- Fiscal deficit target of 3% for states.
- Besides, the Commission has also provided for year-to-year flexibility for additional deficit. It has provided additional headroom to a maximum of 0.5% over and above the normal limit of 3% in any given year to states that have had a favourable debt-GSDP ratio and interest payments-revenue receipts ratio in the previous two years.
- However, the flexibility in availing the additional fiscal deficit will be available to a state if there is no revenue deficit in the year in which borrowing limits are to be fixed and immediately preceding year.
- Since the year 2015-16 is already over, the States will not get any benefit of additional borrowings for 2015-16. However, the implications for the remaining period of FFC award of 2016-17 to 2019-20, would depend upon respective States’ eligibility based on the criteria prescribed by FFC.
- If a State is not able to fully utilise its sanctioned fiscal deficit of 3% of GSDP in any particular year during the 2016-17 to 2018-19 of FFC award period, it will have the option of availing this un-utilised fiscal deficit amount (calculated in rupees) only in the following year but within FFC award period.
Decoupling Growth from Carbon Emission :-
Throughout the 20th century, the global economy was fuelled by burning coal to run factories and power plants, and burning oil to move planes, trains and automobiles. The more coal and oil countries burned — and the more planet-warming carbon dioxide they emitted — the higher the economic growth.
And so it seemed logical that any policy to reduce emissions would also push countries into economic decline.
Now there are signs that GDP growth and carbon emissions need not rise in tandem, and that the era of decoupling could be starting.
In 2014, for the first time in the 40 years since both metrics have been recorded, global GDP grew but global carbon emissions leveled off. Economists got excited, but they also acknowledged that it could have been an anomalous blip. But a study released by the International Energy Agency last month found that the trend continued in 2015.
Of course, even if 21 countries have achieved decoupling, more than 170 countries have not. They continue to follow the traditional economic path of growth directly tied to carbon pollution. Among those are some of the world’s biggest polluters: China, India, Brazil and Indonesia.
And decoupling by just 21 countries is not enough to save the planet as we know it. The decoupled countries lowered emissions about 1 billion tonnes — but overall global emissions grew about 10 billion tonnes.
The question is whether what happened in the 21 countries can be a model for the rest of the world. Almost all of them are European, but not all are advanced Group of 20 economies. Bulgaria, Romania and Uzbekistan are among them.
The Paris Agreement, the landmark climate change accord reached in December, commits nearly every country to actions to tackle climate change — and to continuously increase the intensity of those actions in the coming decades. But absent major breakthroughs in decoupling, governments are likely to be hesitant to take aggressive steps to curb emissions if they mean economic loss.
In the United States, the decoupling of emissions and economic growth was driven chiefly by the boom in domestic natural gas, which when burned produces about half the carbon pollution of coal. The glut of cheap natural gas drove electric utilities away from coal, while still lighting and powering ever more homes and factories. The decoupling was also driven by improvements in energy-efficiency technology.
But decoupling can hurt. Even as the industrial sector grew overall in those years, a push by U.S. factories to use more energy-efficient technology contributed to a 21 percent loss of industrial jobs.
In smaller economies, decoupling hurts less. Sweden experienced economic growth of 31 percent as its emissions fell 8 percent, continuing a long-standing trend driven by its tax on carbon emissions, instituted in 1991. Today Sweden gets nearly half of its electricity from nuclear power, which produces no emissions, and 35 percent from renewable sources, particularly hydroelectric.
But in large, industrial economies that are trying to decouple, the change raises thorny questions. For example, will the pollution just move elsewhere? In Britain, emissions fell 20 percent between 2000 and 2014, while GDP grew 27 percent. That was largely the result of a push to de-industrialize in the country that gave birth to the Industrial Revolution. As Britain’s financial and service sectors grew and its coal mines, mills and steel factories closed, some of those industries went to China, which became the world’s largest polluter.
China’s GDP has increased 270 per cent since 2000 and its carbon emissions 178 per cent. But there are very tentative signs that even China may be decoupling.
China’s emissions may have peaked in 2014 and have now begun a modest decline. It is hard to know for sure because China’s self-reported emissions data can be faulty. But if it is true, and China’s economy continues on even a modest growth path, it could have profound implications for the future of climate change.
Decoupling presents another problem. “The countries that have achieved decoupling have de-industrialized — and that has increased income inequality,One of the things that has not been analyzed is the job prospects for those families. There’s going to be unintended consequences of their livelihoods being curtailed.
Few Facts :-
- ANM Online application-ANMOL .ANMOL is a tablet-based application that allows ANMs (Auxiliary Nurse Midwife) to enter and updated data for beneficiaries of their jurisdiction.
- E-RaktKosh is an integrated Blood Bank Management Information System that has been conceptualized and developed after multiple consultations with all stakeholders. This web-based mechanism interconnects all the Blood Banks of the State into a single network.
- United Nations Industrial Development Organization in its report has placed India at 6th among the world’s top 10 largest manufacturing countries. China tops the list of 10-top industrial producers followed by the US, Japan, Germany and Korea. Indonesia was at the bottom of the list.
Recent Posts
- Items provided through FPS
- The scale of rations
- The price of items distributed through FPS across states.
- Kyoto Protocol of 2001
- Reducing Emissions from Deforestation and Forest Degradation (REDD) as well as REDD+ mechanisms proposed by the United Nations Framework Convention on Climate Change
- United Nations-mandated Sustainable Developmental Goals (SDG)
- Paris Agreement
- Carbon Neutrality
- multistrata agroforestry,
- afforestation,
- tree intercropping,
- biomass production,
- regenerative agriculture,
- conservation agriculture,
- farmland restoration,
- silvopasture,
- tropical-staple tree,
- intercropping,
- bamboo and indigenous tree–based land management.
- Floods
- Cyclones
- Tornadoes and hurricanes (cyclones)
- Hailstorms
- Cloudburst
- Heat wave and cold wave
- Snow avalanches
- Droughts
- Sea erosion
- Thunder/ lightning
- Landslides and mudflows
- Earthquakes
- Large fires
- Dam failures and dam bursts
- Mine fires
- Epidemics
- Pest attacks
- Cattle epidemics
- Food poisoning
- Chemical and Industrial disasters
- Nuclear
- Forest fires
- Urban fires
- Mine flooding
- Oil Spill
- Major building collapse
- Serial bomb blasts
- Festival related disasters
- Electrical disasters and fires
- Air, road, and rail accidents
- Boat capsizing
- Village fire
- Coastal States, particularly on the East Coast and Gujarat are vulnerable to cyclones.
- 4 crore hectare landmass is vulnerable to floods
- 68 per cent of net sown area is vulnerable to droughts
- 55 per cent of total area is in seismic zones III- V, hence vulnerable to earthquakes
- Sub- Himalayan sector and Western Ghats are vulnerable to landslides.
- Mainstreaming of Disaster Risk Reduction in Developmental Strategy-Prevention and mitigation contribute to lasting improvement in safety and should beintegrated in the disaster management. The Government of India has adopted mitigation and prevention as essential components of their development strategy.
- Mainstreaming of National Plan and its Sub-Plan
- National Disaster Mitigation Fund
- National Earthquake Risk Mitigation Project (NERMP)
- National Building Code (NBC):- Earthquake resistant buildings
- National Cyclone Risk Mitigation Project (NCRMP)
- Integrated Coastal Zone Management Project (ICZMP)-The objective of the project is to assist GoI in building the national capacity for implementation of a comprehensive coastal management approach in the country and piloting the integrated coastal zone management approach in states of Gujarat, Orissa and West Bengal.
- National Flood Risk Mitigation Project (NFRMP)
- National Project for Integrated Drought Monitoring & Management
- National Vector Borne Diseases Control Programme (NVBDCP)- key programme
for prevention/control of outbreaks/epidemics of malaria, dengue, chikungunya etc., vaccines administered to reduce the morbidity and mortality due to diseases like measles, diphtheria, pertussis, poliomyelitis etc. Two key measures to prevent/control epidemics of water-borne diseases like cholera, viral hepatitis etc. include making available safe water and ensuring personal and domestic hygienic practices are adopted. - Training
- Education
- Research
- Awareness
- Hyogo Framework of Action- The Hyogo Framework of Action (HFA) 2005-2015 was adopted to work globally towards sustainable reduction of disaster losses in lives and in the social, economic and environmental assets of communities and countries.
- United Nations International Strategy for Disaster Reduction (UNISDR)-In order to build the resilience of nations and communities to disasters through the implementation of the HFA , the UNISDR strives to catalyze, facilitate and mobilise the
commitment and resources of national, regional and international stakeholders of the ISDR
system. - United Nation Disaster Management Team (UNDMT) –
- To ensure a prompt, effective and concerted country-level support to a governmental
response in the event of a disaster, at the central, state and sub-state levels, - To coordinate UN assistance to the government with respect to long term recovery, disaster mitigation and preparedness.
- To coordinate all disaster-related activities, technical advice and material assistance provided by UN agencies, as well as to take steps for optimal utilisation of resources by UN agencies.
- To ensure a prompt, effective and concerted country-level support to a governmental
- Global Facility for Disaster Risk Reduction (GFDRR):-
- GFDRR was set up in September 2006 jointly by the World Bank, donor partners (21countries and four international organisations), and key stakeholders of the International Strategy for Disaster Reduction (UN-ISDR). It is a long-term global partnership under the ISDR system established to develop and implement the HFA through a coordinated programme for reversing the trend in disaster losses by 2015.
- Its mission is to mainstream disaster reduction and climate change adaptation in a country’s development strategies to reduce vulnerability to natural hazards.
- ASEAN Region Forum (ARF)
- Asian Disaster Reduction Centre (ADRC)
- SAARC Disaster Management Centre (SDMC)
- Program for Enhancement of Emergency Response (PEER):-The Program for Enhancement of Emergency Response (PEER) is a regional training programme initiated in 1998 by the United States Agency for International Development’s, Office of U.S Foreign Disaster Assistance (USAID/OFDA) to strengthen disaster response capacities in Asia.
- Policy guidelines at the macro level that would inform and guide the preparation and
implementation of disaster management and development plans across sectors - Building in a culture of preparedness and mitigation
- Operational guidelines of integrating disaster management practices into development, and
specific developmental schemes for prevention and mitigation of disasters - Having robust early warning systems coupled with effective response plans at district, state
and national levels - Building capacity of all stakeholders
- Involving the community, NGOs, CSOs and the media at all stages of DM
- Addressing gender issues in disaster management planning and developing a strategy for
inclusive approach addressing the disadvantaged sections of the society towards disaster risk reduction. - Addressing climate risk management through adaptation and mitigation
- Micro disaster Insurance
- Flood Proofing
- Building Codes and Enforcement
- Housing Design and Finance
- Road and Infrastructure
Petrol in India is cheaper than in countries like Hong Kong, Germany and the UK but costlier than in China, Brazil, Japan, the US, Russia, Pakistan and Sri Lanka, a Bank of Baroda Economics Research report showed.
Rising fuel prices in India have led to considerable debate on which government, state or central, should be lowering their taxes to keep prices under control.
The rise in fuel prices is mainly due to the global price of crude oil (raw material for making petrol and diesel) going up. Further, a stronger dollar has added to the cost of crude oil.
Amongst comparable countries (per capita wise), prices in India are higher than those in Vietnam, Kenya, Ukraine, Bangladesh, Nepal, Pakistan, Sri Lanka, and Venezuela. Countries that are major oil producers have much lower prices.
In the report, the Philippines has a comparable petrol price but has a per capita income higher than India by over 50 per cent.
Countries which have a lower per capita income like Kenya, Bangladesh, Nepal, Pakistan, and Venezuela have much lower prices of petrol and hence are impacted less than India.
“Therefore there is still a strong case for the government to consider lowering the taxes on fuel to protect the interest of the people,” the report argued.
India is the world’s third-biggest oil consuming and importing nation. It imports 85 per cent of its oil needs and so prices retail fuel at import parity rates.
With the global surge in energy prices, the cost of producing petrol, diesel and other petroleum products also went up for oil companies in India.
They raised petrol and diesel prices by Rs 10 a litre in just over a fortnight beginning March 22 but hit a pause button soon after as the move faced criticism and the opposition parties asked the government to cut taxes instead.
India imports most of its oil from a group of countries called the ‘OPEC +’ (i.e, Iran, Iraq, Saudi Arabia, Venezuela, Kuwait, United Arab Emirates, Russia, etc), which produces 40% of the world’s crude oil.
As they have the power to dictate fuel supply and prices, their decision of limiting the global supply reduces supply in India, thus raising prices
The government charges about 167% tax (excise) on petrol and 129% on diesel as compared to US (20%), UK (62%), Italy and Germany (65%).
The abominable excise duty is 2/3rd of the cost, and the base price, dealer commission and freight form the rest.
Here is an approximate break-up (in Rs):
a)Base Price | 39 |
b)Freight | 0.34 |
c) Price Charged to Dealers = (a+b) | 39.34 |
d) Excise Duty | 40.17 |
e) Dealer Commission | 4.68 |
f) VAT | 25.35 |
g) Retail Selling Price | 109.54 |
Looked closely, much of the cost of petrol and diesel is due to higher tax rate by govt, specifically excise duty.
So the question is why government is not reducing the prices ?
India, being a developing country, it does require gigantic amount of funding for its infrastructure projects as well as welfare schemes.
However, we as a society is yet to be tax-compliant. Many people evade the direct tax and that’s the reason why govt’s hands are tied. Govt. needs the money to fund various programs and at the same time it is not generating enough revenue from direct taxes.
That’s the reason why, govt is bumping up its revenue through higher indirect taxes such as GST or excise duty as in the case of petrol and diesel.
Direct taxes are progressive as it taxes according to an individuals’ income however indirect tax such as excise duty or GST are regressive in the sense that the poorest of the poor and richest of the rich have to pay the same amount.
Does not matter, if you are an auto-driver or owner of a Mercedes, end of the day both pay the same price for petrol/diesel-that’s why it is regressive in nature.
But unlike direct tax where tax evasion is rampant, indirect tax can not be evaded due to their very nature and as long as huge no of Indians keep evading direct taxes, indirect tax such as excise duty will be difficult for the govt to reduce, because it may reduce the revenue and hamper may programs of the govt.
Globally, around 80% of wastewater flows back into the ecosystem without being treated or reused, according to the United Nations.
This can pose a significant environmental and health threat.
In the absence of cost-effective, sustainable, disruptive water management solutions, about 70% of sewage is discharged untreated into India’s water bodies.
A staggering 21% of diseases are caused by contaminated water in India, according to the World Bank, and one in five children die before their fifth birthday because of poor sanitation and hygiene conditions, according to Startup India.
As we confront these public health challenges emerging out of environmental concerns, expanding the scope of public health/environmental engineering science becomes pivotal.
For India to achieve its sustainable development goals of clean water and sanitation and to address the growing demands for water consumption and preservation of both surface water bodies and groundwater resources, it is essential to find and implement innovative ways of treating wastewater.
It is in this context why the specialised cadre of public health engineers, also known as sanitation engineers or environmental engineers, is best suited to provide the growing urban and rural water supply and to manage solid waste and wastewater.
Traditionally, engineering and public health have been understood as different fields.
Currently in India, civil engineering incorporates a course or two on environmental engineering for students to learn about wastewater management as a part of their pre-service and in-service training.
Most often, civil engineers do not have adequate skills to address public health problems. And public health professionals do not have adequate engineering skills.
India aims to supply 55 litres of water per person per day by 2024 under its Jal Jeevan Mission to install functional household tap connections.
The goal of reaching every rural household with functional tap water can be achieved in a sustainable and resilient manner only if the cadre of public health engineers is expanded and strengthened.
In India, public health engineering is executed by the Public Works Department or by health officials.
This differs from international trends. To manage a wastewater treatment plant in Europe, for example, a candidate must specialise in wastewater engineering.
Furthermore, public health engineering should be developed as an interdisciplinary field. Engineers can significantly contribute to public health in defining what is possible, identifying limitations, and shaping workable solutions with a problem-solving approach.
Similarly, public health professionals can contribute to engineering through well-researched understanding of health issues, measured risks and how course correction can be initiated.
Once both meet, a public health engineer can identify a health risk, work on developing concrete solutions such as new health and safety practices or specialised equipment, in order to correct the safety concern..
There is no doubt that the majority of diseases are water-related, transmitted through consumption of contaminated water, vectors breeding in stagnated water, or lack of adequate quantity of good quality water for proper personal hygiene.
Diseases cannot be contained unless we provide good quality and adequate quantity of water. Most of the world’s diseases can be prevented by considering this.
Training our young minds towards creating sustainable water management systems would be the first step.
Currently, institutions like the Indian Institute of Technology, Madras (IIT-M) are considering initiating public health engineering as a separate discipline.
To leverage this opportunity even further, India needs to scale up in the same direction.
Consider this hypothetical situation: Rajalakshmi, from a remote Karnataka village spots a business opportunity.
She knows that flowers, discarded in the thousands by temples can be handcrafted into incense sticks.
She wants to find a market for the product and hopefully, employ some people to help her. Soon enough though, she discovers that starting a business is a herculean task for a person like her.
There is a laborious process of rules and regulations to go through, bribes to pay on the way and no actual means to transport her product to its market.
After making her first batch of agarbathis and taking it to Bengaluru by bus, she decides the venture is not easy and gives up.
On the flipside of this is a young entrepreneur in Bengaluru. Let’s call him Deepak. He wants to start an internet-based business selling sustainably made agarbathis.
He has no trouble getting investors and to mobilise supply chains. His paperwork is over in a matter of days and his business is set up quickly and ready to grow.
Never mind that the business is built on aggregation of small sellers who will not see half the profit .
Is this scenario really all that hypothetical or emblematic of how we think about entrepreneurship in India?
Between our national obsession with unicorns on one side and glorifying the person running a pakora stall for survival as an example of viable entrepreneurship on the other, is the middle ground in entrepreneurship—a space that should have seen millions of thriving small and medium businesses, but remains so sparsely occupied that you could almost miss it.
If we are to achieve meaningful economic growth in our country, we need to incorporate, in our national conversation on entrepreneurship, ways of addressing the missing middle.
Spread out across India’s small towns and cities, this is a class of entrepreneurs that have been hit by a triple wave over the last five years, buffeted first by the inadvertent fallout of demonetization, being unprepared for GST, and then by the endless pain of the covid-19 pandemic.
As we finally appear to be reaching some level of normality, now is the opportune time to identify the kind of industries that make up this layer, the opportunities they should be afforded, and the best ways to scale up their functioning in the shortest time frame.
But, why pay so much attention to these industries when we should be celebrating, as we do, our booming startup space?
It is indeed true that India has the third largest number of unicorns in the world now, adding 42 in 2021 alone. Braving all the disruptions of the pandemic, it was a year in which Indian startups raised $24.1 billion in equity investments, according to a NASSCOM-Zinnov report last year.
However, this is a story of lopsided growth.
The cities of Bengaluru, Delhi/NCR, and Mumbai together claim three-fourths of these startup deals while emerging hubs like Ahmedabad, Coimbatore, and Jaipur account for the rest.
This leap in the startup space has created 6.6 lakh direct jobs and a few million indirect jobs. Is that good enough for a country that sends 12 million fresh graduates to its workforce every year?
It doesn’t even make a dent on arguably our biggest unemployment in recent history—in April 2020 when the country shutdown to battle covid-19.
Technology-intensive start-ups are constrained in their ability to create jobs—and hybrid work models and artificial intelligence (AI) have further accelerated unemployment.
What we need to focus on, therefore, is the labour-intensive micro, small and medium enterprise (MSME). Here, we begin to get to a definitional notion of what we called the mundane middle and the problems it currently faces.
India has an estimated 63 million enterprises. But, out of 100 companies, 95 are micro enterprises—employing less than five people, four are small to medium and barely one is large.
The questions to ask are: why are Indian MSMEs failing to grow from micro to small and medium and then be spurred on to make the leap into large companies?
At the Global Alliance for Mass Entrepreneurship (GAME), we have advocated for a National Mission for Mass Entrepreneurship, the need for which is more pronounced now than ever before.
Whenever India has worked to achieve a significant economic milestone in a limited span of time, it has worked best in mission mode. Think of the Green Revolution or Operation Flood.
From across various states, there are enough examples of approaches that work to catalyse mass entrepreneurship.
The introduction of entrepreneurship mindset curriculum (EMC) in schools through alliance mode of working by a number of agencies has shown significant improvement in academic and life outcomes.
Through creative teaching methods, students are encouraged to inculcate 21st century skills like creativity, problem solving, critical thinking and leadership which are not only foundational for entrepreneurship but essential to thrive in our complex world.
Udhyam Learning Foundation has been involved with the Government of Delhi since 2018 to help young people across over 1,000 schools to develop an entrepreneurial mindset.
One pilot programme introduced the concept of ‘seed money’ and saw 41 students turn their ideas into profit-making ventures. Other programmes teach qualities like grit and resourcefulness.
If you think these are isolated examples, consider some larger data trends.
The Observer Research Foundation and The World Economic Forum released the Young India and Work: A Survey of Youth Aspirations in 2018.
When asked which type of work arrangement they prefer, 49% of the youth surveyed said they prefer a job in the public sector.
However, 38% selected self-employment as an entrepreneur as their ideal type of job. The spirit of entrepreneurship is latent and waiting to be unleashed.
The same can be said for building networks of successful women entrepreneurs—so crucial when the participation of women in the Indian economy has declined to an abysmal 20%.
The majority of India’s 63 million firms are informal —fewer than 20% are registered for GST.
Research shows that companies that start out as formal enterprises become two-three times more productive than a similar informal business.
So why do firms prefer to be informal? In most cases, it’s because of the sheer cost and difficulty of complying with the different regulations.
We have academia and non-profits working as ecosystem enablers providing insights and evidence-based models for growth. We have large private corporations and philanthropic and funding agencies ready to invest.
It should be in the scope of a National Mass Entrepreneurship Mission to bring all of them together to work in mission mode so that the gap between thought leadership and action can finally be bridged.
Heat wave is a condition of air temperature which becomes fatal to human body when exposed. Often times, it is defined based on the temperature thresholds over a region in terms of actual temperature or its departure from normal.
Heat wave is considered if maximum temperature of a station reaches at least 400C or more for Plains and at least 300C or more for Hilly regions.
a) Based on Departure from Normal
Heat Wave: Departure from normal is 4.50C to 6.40C
Severe Heat Wave: Departure from normal is >6.40C
b) Based on Actual Maximum Temperature
Heat Wave: When actual maximum temperature ≥ 450C
Severe Heat Wave: When actual maximum temperature ≥470C
If above criteria met at least in 2 stations in a Meteorological sub-division for at least two consecutive days and it declared on the second day
It is occurring mainly during March to June and in some rare cases even in July. The peak month of the heat wave over India is May.
Heat wave generally occurs over plains of northwest India, Central, East & north Peninsular India during March to June.
It covers Punjab, Haryana, Delhi, Uttar Pradesh, Bihar, Jharkhand, West Bengal, Odisha, Madhya Pradesh, Rajasthan, Gujarat, parts of Maharashtra & Karnataka, Andhra Pradesh and Telengana.
Sometimes it occurs over Tamilnadu & Kerala also.
Heat waves adversely affect human and animal lives.
However, maximum temperatures more than 45°C observed mainly over Rajasthan and Vidarbha region in month of May.

a. Transportation / Prevalence of hot dry air over a region (There should be a region of warm dry air and appropriate flow pattern for transporting hot air over the region).
b. Absence of moisture in the upper atmosphere (As the presence of moisture restricts the temperature rise).
c. The sky should be practically cloudless (To allow maximum insulation over the region).
d. Large amplitude anti-cyclonic flow over the area.
Heat waves generally develop over Northwest India and spread gradually eastwards & southwards but not westwards (since the prevailing winds during the season are westerly to northwesterly).
The health impacts of Heat Waves typically involve dehydration, heat cramps, heat exhaustion and/or heat stroke. The signs and symptoms are as follows:
1. Heat Cramps: Ederna (swelling) and Syncope (Fainting) generally accompanied by fever below 39*C i.e.102*F.
2. Heat Exhaustion: Fatigue, weakness, dizziness, headache, nausea, vomiting, muscle cramps and sweating.
3. Heat Stoke: Body temperatures of 40*C i.e. 104*F or more along with delirium, seizures or coma. This is a potential fatal condition.

Norman Borlaug and MS Swaminathan in a wheat field in north India in March 1964
Political independence does not have much meaning without economic independence.
One of the important indicators of economic independence is self-sufficiency in food grain production.
The overall food grain scenario in India has undergone a drastic transformation in the last 75 years.
India was a food-deficit country on the eve of Independence. It had to import foodgrains to feed its people.
The situation became more acute during the 1960s. The imported food had to be sent to households within the shortest possible time.
The situation was referred to as ‘ship to mouth’.
Presently, Food Corporation of India (FCI) godowns are overflowing with food grain stocks and the Union government is unable to ensure remunerative price to the farmers for their produce.
This transformation, however, was not smooth.
In the 1960s, it was disgraceful, but unavoidable for the Prime Minister of India to go to foreign countries with a begging bowl.
To avoid such situations, the government motivated agricultural scientists to make India self-sufficient in food grain production.
As a result, high-yield varieties (HYV) were developed. The combination of seeds, water and fertiliser gave a boost to food grain production in the country which is generally referred to as the Green Revolution.
The impact of the Green Revolution, however, was confined to a few areas like Punjab, Haryana, western Uttar Pradesh in the north and (unified) Andhra Pradesh in the south.
Most of the remaining areas were deficit in food grain production.
Therefore the Union government had to procure food grain from surplus states to distribute it among deficit ones.
At the time, farmers in the surplus states viewed procurement as a tax as they were prevented from selling their surplus foodgrains at high prices in the deficit states.
As production of food grains increased, there was decentralisation of procurement. State governments were permitted to procure grain to meet their requirement.
The distribution of food grains was left to the concerned state governments.
Kerala, for instance, was totally a deficit state and had to adopt a distribution policy which was almost universal in nature.
Some states adopted a vigorous public distribution system (PDS) policy.
It is not out of place to narrate an interesting incident regarding food grain distribution in Andhra Pradesh. The Government of Andhra Pradesh in the early 1980s implemented a highly subsidised rice scheme under which poor households were given five kilograms of rice per person per month, subject to a ceiling of 25 kilograms at Rs 2 per kg. The state government required two million tonnes of rice to implement the scheme. But it received only on one million tonne from the Union government.
The state government had to purchase another million tonne of rice from rice millers in the state at a negotiated price, which was higher than the procurement price offered by the Centre, but lower than the open market price.
A large number of studies have revealed that many poor households have been excluded from the PDS network, while many undeserving households have managed to get benefits from it.
Various policy measures have been implemented to streamline PDS. A revamped PDS was introduced in 1992 to make food grain easily accessible to people in tribal and hilly areas, by providing relatively higher subsidies.
Targeted PDS was launched in 1997 to focus on households below the poverty line (BPL).
Antyodaya Anna Yojana (AAY) was introduced to cover the poorest of the poor.
Annapoorna Scheme was introduced in 2001 to distribute 10 kg of food grains free of cost to destitutes above the age of 65 years.
In 2013, the National Food Security Act (NFSA) was passed by Parliament to expand and legalise the entitlement.
Conventionally, a card holder has to go to a particular fair price shop (FPS) and that particular shop has to be open when s/he visits it. Stock must be available in the shop. The card holder should also have sufficient time to stand in the queue to purchase his quota. The card holder has to put with rough treatment at the hands of a FPS dealer.
These problems do not exist once ration cards become smart cards. A card holder can go to any shop which is open and has available stocks. In short, the scheme has become card holder-friendly and curbed the monopoly power of the FPS dealer. Some states other than Chhattisgarh are also trying to introduce such a scheme on an experimental basis.
More recently, the Government of India has introduced a scheme called ‘One Nation One Ration Card’ which enables migrant labourers to purchase rations from the place where they reside. In August 2021, it was operational in 34 states and Union territories.
The intentions of the scheme are good but there are some hurdles in its implementation which need to be addressed. These problems arise on account of variation in:
It is not clear whether a migrant labourer gets items provided in his/her native state or those in the state s/he has migrated to and what prices will s/he be able to purchase them.
The Centre must learn lessons from the experiences of different countries in order to make PDS sustainable in the long-run.
For instance, Sri Lanka recently shifted to organic manure from chemical fertiliser without required planning. Consequently, it had to face an acute food shortage due to a shortage of organic manure.
Some analysts have cautioned against excessive dependence on chemical fertiliser.
Phosphorus is an important input in the production of chemical fertiliser and about 70-80 per cent of known resources of phosphorus are available only in Morocco.
There is possibility that Morocco may manipulate the price of phosphorus.
Providing excessive subsidies and unemployment relief may make people dependent, as in the case of Venezuela and Zimbabwe.
It is better to teach a person how to catch a fish rather than give free fish to him / her.
Hence, the government should give the right amount of subsidy to deserving people.
The government has to increase livestock as in the case of Uruguay to make the food basket broad-based and nutritious. It has to see to it that the organic content in the soil is adequate, in order to make cultivation environmentally-friendly and sustainable in the long-run.
In short, India has transformed from a food-deficit state to a food-surplus one 75 years after independence. However, the government must adopt environmental-friendly measures to sustain this achievement.
Agroforestry is an intentional integration of trees on farmland.
Globally, it is practised by 1.2 billion people on 10 per cent area of total agricultural lands (over 1 billion hectares).
It is widely popular as ‘a low hanging fruit’ due to its multifarious tangible and intangible benefits.
The net carbon sequestered in agroforestry is 11.35 tonnes of carbon per ha
A panacea for global issues such as climate change, land degradation, pollution and food security, agroforestry is highlighted as a key strategy to fulfil several targets:

In 2017, a New York Times bestseller Project Drawdown published by 200 scientists around the world with a goal of reversing climate change, came up with the most plausible 100 solutions to slash–down greenhouse gas (GHG) emissions.
Out of these 100 solutions, 11 strategies were highlighted under the umbrella of agroforestry such as:-
Nowadays, tree-based farming in India is considered a silver bullet to cure all issues.
It was promoted under the Green India mission of 2001, six out of eight missions under the National Action Plan on Climate Change (NAPCC) and National Agroforestry and Bamboo Mission (NABM), 2017 to bring a third of the geographical area under tree cover and offsetting GHG emissions.
These long-term attempts by the Government of India have helped enhance the agroforestry area to 13.75 million hectares.
The net carbon sequestered in agroforestry is 11.35 tonnes of carbon per ha and carbon sequestration potential is 0.35 tonnes of carbon per ha per year at the country level, according to the Central Agroforestry Research Institute, Jhansi.
India will reduce an additional 2.5-3 billion tonnes of CO2 by increasing tree cover. This extra tree cover could be achieved through agroforestry systems because of their ability to withstand minimum inputs under extreme situations.
Here are some examples which portray the role of agroforestry in achieving at least nine out of the 17 SDGs through sustainable food production, ecosystem services and economic benefits:
SDG 1 — No Poverty: Almost 736 million people still live in extreme poverty. Diversification through integrating trees in agriculture unlocks the treasure to provide multifunctional benefits.
Studies carried out in 2003 in the arid regions of India reported a 10-15 per cent increase in crop yield with Prosopis cineraria (khejari). Adoption of agroforestry increases income & production by reducing the cost of input & production.
SDG 2 — Zero hunger: Tree-based systems provide food and monetary returns. Traditional agroforestry systems like Prosopis cineraria and Madhuca longifolia (Mahua) provide edible returns during drought years known as “lifeline to the poor people”.
Studies showed that 26-50 per cent of households involved in tree products collection and selling act as a coping strategy to deal with hunger.
SDG 3 — Good health and well-being: Human wellbeing and health are depicted through the extent of healthy ecosystems and services they provide.
Agroforestry contributes increased access to diverse nutritious food, supply of medicine, clean air and reduces heat stress.
Vegetative buffers can filter airstreams of particulates by removing dust, gas, microbial constituents and heavy metals.
SDG 5 — Gender equality: Throughout the world around 3 billion people depend on firewood for cooking.
In this, women are the main collectors and it brings drudgery and health issues.
A study from India stated that almost 374 hours per year are spent by women for collection of firewood. Growing trees nearby provides easy access to firewood and diverts time to productive purposes.
SDG 6 — Clean Water and Sanitation: Water is probably the most vital resource for our survival. The inherent capacity of trees offers hydrological regulation as evapotranspiration recharges atmospheric moisture for rainfall; enhanced soil infiltration recharges groundwater; obstructs sediment flow; rainwater filtration by accumulation of heavy metals.
An extensive study in 35 nations published in 2017 concluded that 30 per cent of tree cover in watersheds resulted in improved sanitisation and reduced diarrheal disease.
SDG 7 — Affordable & Clean Energy: Wood fuels are the only source of energy to billions of poverty-stricken people.
Though trees are substitutes of natural forests, modern technologies in the form of biofuels, ethanol, electricity generation and dendro-biomass sources are truly affordable and clean.
Ideal agroforestry models possess fast-growing, high coppicing, higher calorific value and short rotation (2-3 years) characteristics and provide biomass of 200-400 tonnes per ha.
SDG 12 — Responsible consumption and production: The production of agricultural and wood-based commodities on a sustainable basis without depleting natural resources and as low as external inputs (chemical fertilisers and pesticides) to reduce the ecological footprints.
SDG 13 — Climate action: Globally, agricultural production accounts for up to 24 per cent of GHG emissions from around 22.2 million square km of agricultural area, according to the Food and Agriculture Organization.
A 2016 study depicted that conversion of agricultural land to agroforestry sequesters about 27.2± 13.5 tonnes CO2 equivalent per ha per year after establishment of systems.
Trees on farmland mitigate 109.34 million tonnes CO2 equivalent annually from 15.31 million ha, according to a 2017 report. This may offset a third of the total GHG emissions from the agriculture sector of India.
SDG 15 — Life on Land: Agroforestry ‘mimics the forest ecosystem’ to contribute conservation of flora and faunas, creating corridors, buffers to existing reserves and multi-functional landscapes.
Delivery of ecosystem services of trees regulates life on land. A one-hectare area of homegardens in Kerala was found to have 992 trees from 66 species belonging to 31 families, a recent study showed.
The report of the World Agroforestry Centre highlighted those 22 countries that have registered agroforestry as a key strategy in achieving their unconditional national contributions.
Recently, the Government of India has allocated significant financial support for promotion of agroforestry at grassroot level to make the Indian economy as carbon neutral. This makes agroforestry a low-hanging fruit to achieve the global goals.
A disaster is a result of natural or man-made causes that leads to sudden disruption of normal life, causing severe damage to life and property to an extent that available social and economic protection mechanisms are inadequate to cope.
The International Strategy for Disaster Reduction (ISDR) of the United Nations (U.N.) defines a hazard as “a potentially damaging physical event, phenomenon or human activity that may cause the loss of life or injury, property damage, social and economic disruption or environmental degradation.”
Disasters are classified as per origin, into natural and man-made disasters. As per severity, disasters are classified as minor or major (in impact). However, such classifications are more academic than real.
High Powered Committee (HPC) was constituted in August 1999 under the chairmanship of J.C.Pant. The mandate of the HPC was to prepare comprehensive model plans for disaster management at the national, state and district levels.
This was the first attempt in India towards a systematic comprehensive and holistic look at all disasters.
Thirty odd disasters have been identified by the HPC, which were grouped into the following five categories, based on generic considerations:-
Water and Climate Related:-
Geological:-
Biological:-
Chemical, industrial and nuclear:-
Accidental:-
India’s Key Vulnerabilities as articulated in the Tenth Plan, (2002-07) are as follows:

Vulnerability is defined as:-
“the extent to which a community, structure, service, or geographic area is likely to be damaged or disrupted by the impact of particular hazard, on account of their nature, construction and proximity to hazardous terrain or a disaster prone area”.
The concept of vulnerability therefore implies a measure of risk combined with the level of social and economic ability to cope with the resulting event in order to resist major disruption or loss.
Example:- The 1993 Marathwada earthquake in India left over 10,000 dead and destroyed houses and other properties of 200,000 households. However, the technically much more powerful Los Angeles earthquake of 1971 (taken as a benchmark in America in any debate on the much-apprehended seismic vulnerability of California) left over 55 dead.
Physical Vulnerability:-
Physical vulnerability relates to the physical location of people, their proximity to the hazard zone and standards of safety maintained to counter the effects.
The Indian subcontinent can be primarily divided into three geophysical regions with regard to vulnerability, broadly, as, the Himalayas, the Plains and the Coastal areas.
Socio-economic Vulnerability:-
The degree to which a population is affected by a calamity will not purely lie in the physical components of vulnerability but in contextual, relating to the prevailing social and economic conditions and its consequential effects on human activities within a given society.
Global Warming & Climate Change:-
Global warming is going to make other small local environmental issues seemingly insignificant, because it has the capacity to completely change the face of the Earth. Global warming is leading to shrinking glaciers and rising sea levels. Along with floods, India also suffers acute water shortages.
The steady shrinking of the Himalayan glaciers means the entire water system is being disrupted; global warming will cause even greater extremes. Impacts of El Nino and La Nina have increasingly led to disastrous impacts across the globe.
Scientifically, it is proven that the Himalayan glaciers are shrinking, and in the next fifty to sixty years they would virtually run out of producing the water levels that we are seeing now.
This will cut down drastically the water available downstream, and in agricultural economies like the plains of Uttar Pradesh (UP) and Bihar, which are poor places to begin with. That, as one may realise, would cause tremendous social upheaval.
Urban Risks:-
India is experiencing massive and rapid urbanisation. The population of cities in India is doubling in a period ranging just two decades according to the trends in the recent past.
It is estimated that by 2025, the urban component, which was only 25.7 per cent (1991) will be more than 50 per cent.
Urbanisation is increasing the risks at unprecedented levels; communities are becoming increasingly vulnerable, since high-density areas with poorly built and maintained infrastructure are subjected to natural hazards, environmental degradation, fires, flooding and earthquake.
Urbanisation dramatically increases vulnerability, whereby communities are forced to squat on environmentally unstable areas such as steep hillsides prone to landslide, by the side of rivers that regularly flood, or on poor quality ground, causing building collapse.
Most prominent amongst the disasters striking urban settlements frequently are, floods and fire, with incidences of earthquakes, landslides, droughts and cyclones. Of these, floods are more devastating due to their widespread and periodic impact.
Example: The 2005 floods of Maharashtra bear testimony to this. Heavy flooding caused the sewage system to overflow, which contaminated water lines. On August 11, the state government declared an epidemic of leptospirosis in Mumbai and its outskirts.
Developmental activities:-
Developmental activities compound the damaging effects of natural calamities. The floods in Rohtak (Haryana) in 1995 are an appropriate example of this. Even months after the floodwaters had receded; large parts of the town were still submerged.
Damage had not accrued due to floods, but due to water-logging which had resulted due to peculiar topography and poor land use planning.
Disasters have come to stay in the forms of recurring droughts in Orissa, the desertification of swaths of Gujarat and Rajasthan, where economic depredations continuously impact on already fragile ecologies and environmental degradation in the upstream areas of Uttar Pradesh and Bihar.
Floods in the plains are taking an increasing toll of life, environment, and property, amplified by a huge population pressure.
The unrestricted felling of forests, serious damage to mountain ecology, overuse of groundwater and changing patterns of cultivation precipitate recurring floods and droughts.
When forests are destroyed, rainwater runs off causing floods and diminishing the recharging of groundwater.
The spate of landslides in the Himalayas in recent years can be directly traced to the rampant deforestation and network of roads that have been indiscriminately laid in the name of development.
Destruction of mangroves and coral reefs has increased the vulnerability of coastal areas to hazards, such as storm surges and cyclones.
Commercialisation of coastal areas, particularly for tourism has increased unplanned development in these areas, which has increased disaster potential, as was demonstrated during the Tsunami in December 2004.
Environmental Stresses:- " Delhi-Case Study"
Every ninth student in Delhi’s schools suffers from Asthma. Delhi is the world’s fourth most polluted city.
Each year, poor environmental conditions in the city’s informal areas lead to epidemics.
Delhi has one of the highest road accident fatality ratios in the world. In many ways, Delhi reflects the sad state of urban centers within India that are exposed to risks, which are misconstrued and almost never taken into consideration for urban governance.
The main difference between modernism and postmodernism is that modernism is characterized by the radical break from the traditional forms of urban architecture whereas postmodernism is characterized by the self-conscious use of earlier styles and conventions.


Illustration of Disaster Cycle through Case Study:-
The processes covered by the disaster cycle can be illustrated through the case of the Gujarat Earthquake of 26 January 2001. The devastating earthquake killed thousands of people and destroyed hundreds of thousands of houses and other buildings.
The State Government as well as the National Government immediately mounted a largescale relief operation. The help of the Armed Forces was also taken.
Hundreds of NGOs from within the region and other parts of the country as well as from other countries of the world came to Gujarat with relief materials and personnel to help in the relief operations.
Relief camps were set up, food was distributed, mobile hospitals worked round the clock to help the injured; clothing, beddings, tents, and other commodities were distributed to the affected people over the next few weeks.
By the summer of 2001, work started on long-term recovery. House reconstruction programmes were launched, community buildings were reconstructed, and damaged infrastructure was repaired and reconstructed.
Livelihood programmes were launched for economic rehabilitation of the affected people.
In about two year’s time the state had bounced back and many of the reconstruction projects had taken the form of developmental programmes aiming to deliver even better infrastructure than what existed before the earthquake.
Good road networks, water distribution networks, communication networks, new schools, community buildings, health and education programmes, all worked towards developing the region.
The government as well as the NGOs laid significant emphasis on safe development practices. The buildings being constructed were of earthquake resistant designs.
Older buildings that had survived the earthquake were retrofitted in large numbers to strengthen them and to make them resistant to future earthquakes. Mason and engineer training programmes were carried out at a large scale to ensure that all future construction in the State is disaster resistant.
This case study shows how there was a disaster event during the earthquake, followed by immediate response and relief, then by recovery including rehabilitation and retrofitting, then by developmental processes.
The development phase included mitigation activities, and finally preparedness actions to face future disasters.
Then disaster struck again, but the impact was less than what it could have been, primarily due to better mitigation and preparedness efforts.

Looking at the relationship between disasters and development one can identify ‘four’ different dimensions to this relation:
1) Disasters can set back development
2) Disasters can provide development opportunities
3) Development can increase vulnerability and
4) Development can reduce vulnerability
The whole relationship between disaster and development depends on the development choice made by the individual, community and the nation who implement the development programmes.
The tendency till now has been mostly to associate disasters with negativities. We need to broaden our vision and work on the positive aspects associated with disasters as reflected below:

1)Evolution of Disaster Management in India
Disaster management in India has evolved from an activity-based reactive setup to a proactive institutionalized structure; from single faculty domain to a multi-stakeholder setup; and from a relief-based approach to a ‘multi-dimensional pro-active holistic approach for reducing risk’.
Over the past century, the disaster management in India has undergone substantive changes in its composition, nature and policy.
2)Emergence of Institutional Arrangement in India-
A permanent and institutionalised setup began in the decade of 1990s with set up of a disaster management cell under the Ministry of Agriculture, following the declaration of the decade of 1990 as the ‘International Decade for Natural Disaster Reduction’ (IDNDR) by the UN General Assembly.
Consequently, the disaster management division was shifted under the Ministry of Home Affairs in 2002
3)Disaster Management Framework:-
Shifting from relief and response mode, disaster management in India started to address the
issues of early warning systems, forecasting and monitoring setup for various weather related
hazards.
National Level Institutions:-National Disaster Management Authority (NDMA):-
The National Disaster Management Authority (NDMA) was initially constituted on May 30, 2005 under the Chairmanship of Prime Minister vide an executive order.
SDMA (State Level, DDMA(District Level) also present.
National Crisis Management Committee (NCMC)
Legal Framework For Disaster Management :-
DMD- Disaster management Dept.
NIDM- National Institute of Disaster Management
NDRF – National Disaster Response Fund
Cabinet Committee on Disaster Management-
Location of NDRF Battallions(National Disaster Response Force):-
CBRN- Chemical, Biological, Radiological and Nuclear
Policy and response to Climate Change :-
1)National Action Plan on Climate Change (NAPCC)-
National Action Plan on Climate Change identified Eight missions.
• National Solar Mission
• National Mission on Sustainable Habitat
• National Mission for Enhanced Energy Efficiency
• National Mission for Sustaining The Himalayan Ecosystem
• National Water Mission
• National Mission for Green India
• National Mission for Sustainable Agriculture
• National Mission for Strategic Knowledge on Climate Change
2)National Policy on Disaster Management (NPDM),2009-
The policy envisages a safe and disaster resilient India by developing a holistic, proactive, multi-disaster oriented and technologydriven strategy through a culture of prevention, mitigation, preparedness and response. The policy covers all aspects of disaster management including institutional and legal arrangements,financial arrangements, disaster prevention, mitigation and preparedness, techno-legal regime, response, relief and rehabilitation, reconstruction and recovery, capacity development, knowledge management, research and development. It focuses on the areas where action is needed and the institutional mechanism through which such action can be channelised.
Prevention and Mitigation Projects:-
Early Warning Nodal Agencies:-
Post Disaster Management :-Post disaster management responses are created according to the disaster and location. The principles being – Faster Recovery, Resilient Reconstruction and proper Rehabilitation.
Capacity Development:-
Components of capacity development includes :-
National Institute for Capacity Development being – National Institute of Disaster Management (NIDM)
International Cooperation-
Way Forward:-
Principles and Steps:-


