
National Hydrology Project:-
Background :-The Union Cabinet chaired by the Prime Minister has given its approval to Implementation of the National Hydrology Project.The National Hydrology Project (NHP) is intended for setting up of a system for timely and reliable water resources data acquisition, storage, collation and management. It will also provide tools/systems for informed decision making through Decision Support Systems (DSS) for water resources assessment, flood management, reservoir operations, drought management, etc. NHP also seeks to build capacity of the State and Central sector organisations in water resources management through the use of Information Systems and adoption of State-of-the-art technologies like Remote Sensing.
Details:-
The NHP will help in gathering Hydro-meteorological data which will be stored and analysed on a real time basis and can be seamlessly accessed by any user at the State/District/village level. The project envisages to cover the entire country as the earlier hydrology projects covered only 13 States.
The components of the proposal are:
- In Situ Hydromet Monitoring System and Hydromet Data Acquisition System.
- Setting up of National Water Informatics Centre (NWIC).
- Water Resources Operation and Management System
- Water Resources Institutions and Capacity Building
The NHP will result in the improvement of:
- Data storage, exchange, analysis and dissemination through National Water Informatics Centre.
- Lead time in flood forecast from 1 day to at least 3 days
- Mapping of flood inundation areas for use by the disaster management authorities
- Assessment of surface and ground water resources in a river basin for better planning & allocation for PMKSY and other schemes of Govt. of India
- Reservoir operations through seasonal yield forecast, drought management, SCADA systems, etc.
- Design of SW & GW structures, hydropower units, interlinking of rivers, Smart Cities.
- Fulfilling the objectives of Digital India.
- People Centric approach: The programme envisages ultimate aim for water management through scientific data collection, dissemination of information on water availability in all blocks of the country and establishing of National Water Information Centre. The automated systems for Flood Forecasting is aimed to reduce water disaster ultimately helping vulnerable population. It is people and farmer centric programme as information on water can help in predicting water availability and help farmers to plan their crops and other farm related activities. Through this programme India would make a place among nations known for scientific endeavors.
Different names of New year :-
Background :- Presidents of India’s greeting.
- Ugadi – Celebrated in Andhra Pradesh, telengana, Karnataka
- Gudi Padva:- Celebrated in Maharastra
- Chaitra Sukladi – North India
- Cheti Chand – Sindh region of India and Pakistan
- Navreh – Kashmir
- Sajibu Cheiraoba – Manipur
- Thapna – Rajasthan
Terrorism is on the rise – but there’s a bigger threat we’re not talking about
Note :- Data are given for understanding purpose only and except few not much of the data can be helpful from exam point of view.Hence, read with due care.
High-profile attacks on major cities in Belgium, France and the United States have set the world on edge. Commentators are talking of a new kind of protracted guerrilla war stretching from the Americas and Europe across Africa, Asia and the Arab world. This one is irregular, hybrid and networked, involving a constellation of terrorist organizations such as ISIS and Al Qaeda. Rather than hitting specific groups of people or symbolic sites, cities themselves are coming under siege. Complicating matters, violent extremists are recruiting directly from poorer and marginal neighbourhoods across the West.
The extent of local recruitment and so-called “extremist travelling” from Western countries is certainly cause for concern. One study estimates that as many as 31,000 people from 86 countries have made the trip to Iraq or Syria to join ISIS or other extremist groups since June 2014. It is not just Western Europe or North America that is proving to be fertile ground for so-called remote radicalization, but also Russia and Central Asia. Many foreign fighters are killed while fighting abroad, but as many as 30% of them eventually make the trip back home. Politicians are scrambling to respond and hate crimes against minority groups are on the rise.
It is statistically undeniable that terrorist violence is on the rise. But is today’s terrorist violence really more intense and widespread than in, say, the 1960s and 1970s? Are Western European and North American cities really the new front line of a global jihad? The answer partly depends on how terrorism is defined. There is currently no international legal or even academic agreement on what constitutes terrorism. Some experts say that it consists of violence perpetrated by non-state actors against civilians to achieve political religious or ideological change, but that sounds a lot like armed conflict. Complicating matters, governments routinely conflate terrorism and insurgency.

One way to better map out the extent of the terrorist threat is to follow the data. Notwithstanding serious challenges related to the quality and coverage of statistics on terrorism, warfare and homicide, it is possible to detect trends and patterns by honing in on the prevalence of lethal violence.
A not-so global jihad
It turns out that extremist violence is much less pervasive than you might think. As other analysts have noted, it is significantly more prolific outside Western countries than in them. A recent assessment of terrorist risks in 1,300 cities ranked urban centres in Afghanistan, Iraq, Libya, Nigeria, Pakistan and Somalia as significantly more vulnerable than those in Belgium, France, the UK or the US. At least 65 cities were described as facing extreme risk, with Iraq – especially Baghdad, Mosul, Al Ramadi, Ba´qubah, Kirkuk and Al Hillah – fielding six of the top 10. Consider that between 2000 and 2014, there were around 3,659 terrorist-related deaths in all Western countries combined. In Baghdad there were 1,141 deaths and 3,654 wounded in 2014 alone.
It is true that there have been dozens of terrorist attacks in recent years, but how are they spread around the world? The Global Terrorism Database (GTD) tracks terrorist-related fatalities between 2005 and 2014 in 160 countries. In a handful of cases where there is ongoing warfare – including Afghanistan, Iraq, Syria and Yemen – the GTD sometimes conflates terrorist and conflict-related deaths. The authors of the database go to great lengths to avoid this from happening, but it is unavoidable. There are alternative datasets that apply much more restrictive inclusion criteria, but they are not as broad in their coverage and also suffer flaws. Rather than focusing on absolute numbers of violent deaths, it may be more useful to consider prevalence rates.
On the one hand, most countries at the top of the list of most terrorism-prone are clustered in North Africa, the Middle East and South Asia. They include war-torn countries such as Iraq, Afghanistan, Somalia, Libya, the Occupied Palestinian Territories, Lebanon, Israel, Yemen, Pakistan and Syria. Other countries in the top 15 are more unexpected, not least the Former Yugoslavian Republic of Macedonia, Central African Republic, and Kenya. Belgium comes in at 86th place while France and the United States come in at 98th and 105th respectively. These latter rankings will obviously shift upwards given recent attacks in 2015 and 2016, but not by as much as you might expect.

Note: Fatalities are classified as terrorist-related if the action occurs outside the context of legitimate warfare activities, insofar as it targets non‐combatants as expressed by international humanitarian law.
Victims of war
Innocent civilians are much more likely to be killed during the course of armed conflicts. The difference between the two is that terrorism is intended specifically to indiscriminately kill civilians, while in wars the killing of innocent civilians and prisoners is expressly prohibited, even if it does occur. War-related killings may be labelled criminal or even terrorist when they are determined to be disproportionate. So how does the risk rating of violent deaths occurring in war zones compare to those due to terrorism? The Uppsala Conflict Database Program records conflict deaths occurring in more than 60 wars between 2005 and 2014. After adjusting the absolute numbers of violent deaths relative to the total population per country, it is possible to determine an approximate conflict death rate per 100,000 people.
It turns out that the risk of dying violently from war is considerable higher than the probability of being killed in the course of extremist violence. Although in some countries this risk is an order of magnitude higher, the overall conflict death rate in conflict zones is still far lower than many might have predicted. For example, the average conflict death rate is sky-high in Syria – site of some of the most horrific warfare over the past decade. But it is comparatively lower in places like Afghanistan, Iraq, Libya, South Sudan, Chad and Yemen, countries that have been exposed to industrial-scale violence. The conflict death rate of course varies according to the ebb and flow of warfare, but the average prevalence is surprisingly low.
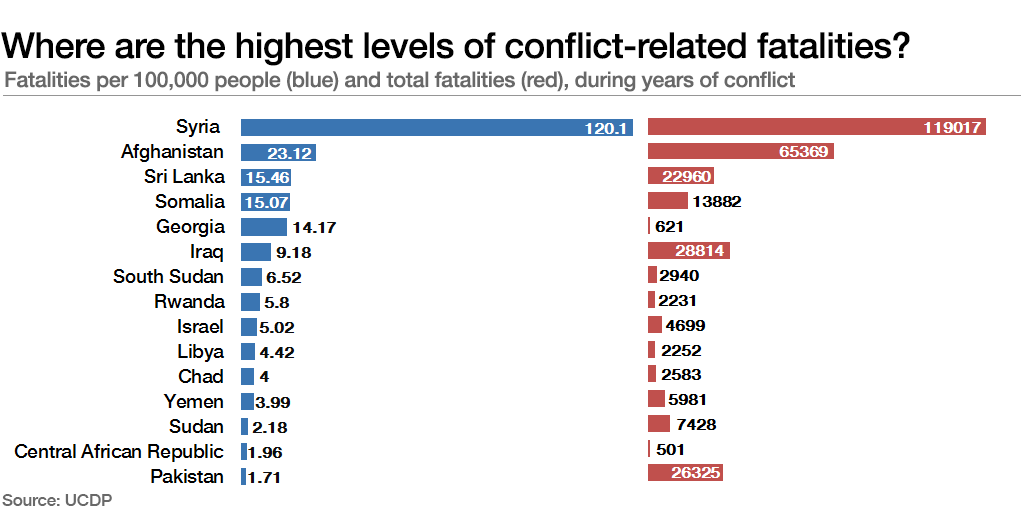
Note: Conflict deaths are defined as “battle deaths” caused by warring parties that can be directly attributed to combat. This includes traditional battlefield fighting, guerrilla activity, bombardment of bases and other actions where the target are military forces or representatives of the parties. Collateral damage, including civilian deaths, are counted.
The greatest threat of all: homicide
And now for the most surprising finding of all. A review of the data reveals that civilians around the world are much more at risk of being killed as result of homicide than either terrorist violence or warfare. Drawing on the Homicide Monitor, it is possible to track murder rates for more than 225 countries and territories from 2005 to 2014.
Although homicidal violence is steadily declining in most parts of the world, it still presents one of the greatest threats of what public health experts call external causes of mortality – especially among young adult and adolescent males.
As in the case of terrorist and conflict-related violence, there are also hot spots where murder tends to concentrate. People living in Central and South America, the Caribbean and Southern Africa are more at risk of dying of homicide than in most other places. The most murderous countries in the world include El Salvador, Honduras, Jamaica, Venezuela, the US Virgin Islands, Guatemala, Saint Kitts and Nevis, Belize, Colombia, Trinidad and Tobago, and Brazil. About 46 of the 50 most violent cities are concentrated in the Americas. Also included in the top 15 most murderous countries, though located outside the Americas, are South Africa, Swaziland and the Democratic Republic of Congo.
And beyond these pockets of extreme homicidal violence, the risk of murder is also more widely distributed than violent deaths associated with terrorism or war. There are roughly 85 countries that are consistently above the global average of around seven homicides per 100,000 people. In fact, about nine in every 10 violent deaths occurring around the world over the past decade were due to murder; just a fraction can be attributed to either war or terrorism. This is not to minimize the real dangers and destruction associated with these latter phenomena, but rather to ensure that we keep our eye firmly on the ball.
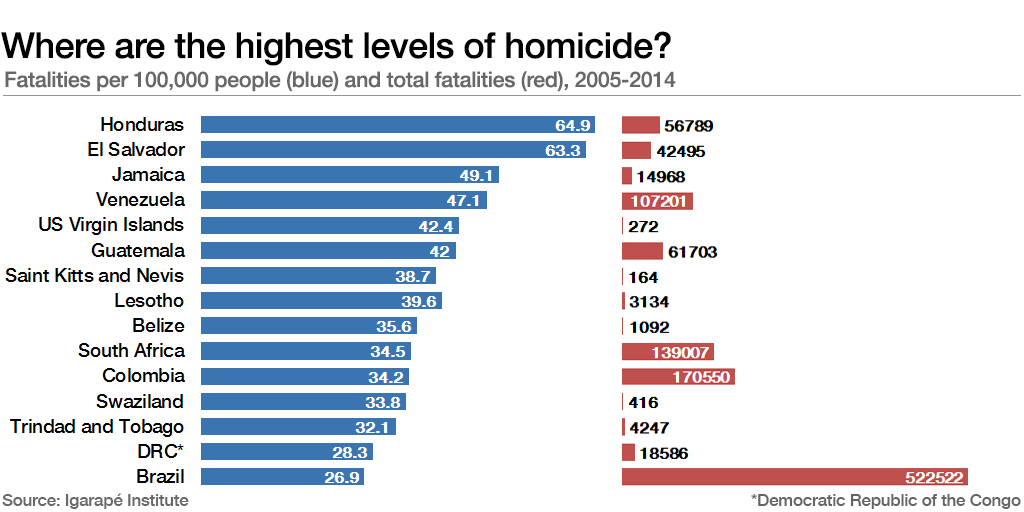
Note: Homicides are defined as the deliberate and unlawful killing of one person by another and are registered by police and health departments.
Drawing lessons from the data
So what does this morbid retreat into the data of violent death tell us? First, it is a reminder that a relatively small number of countries are dramatically more at risk of terrorist and conflict-related violence than others – especially Afghanistan, Iraq, Libya, Nigeria, Pakistan, Somalia, Syria and Yemen. While they must protect their homeland from terrorist events, diplomats, development experts and defence specialists would do well to double down on preventive diplomacy and conflict prevention in the most badly affected countries. Doing so could have a dramatic effect on reducing the global burden of terrorist and conflict violence and related humanitarian consequences such as refugee flows and internal population displacement.
Second, there are also a handful of countries – most of them in Latin America and the Caribbean – where homicidal violence is off-the charts. Most of the murders in these states are concentrated in fast-growing large- and medium-sized cities. If homicides are to be reduced there, it is essential that federal and municipal planners focus on risk factors that are driving urban violence – not least social and economic inequality, high rates of youth unemployment, poor and uneven governance, and the limited purchase of the rule of law. There is mounting evidence of data-driven strategies that work – including focused-deterrence, cognitive therapy and targeted prevention, but they need sustained leadership to have lasting effect.
Finally, we need to get better at nurturing resilience – the ability to cope, adapt and rebound in the face of adversity – in high-risk communities. While obviously distinct in their causes and consequences, there are still many commonalities connecting terrorist, conflict and homicidal violence. When communities are disorganized and suffer from neglect, there is a higher likelihood of politically, criminally and ideologically motivated organized violence erupting. Governments, businesses and civil society groups need to make sure that political settlements are inclusive, that marginalized groups and broken families are taken care of, and that resilience is designed in to communities from the get-go
ISBN Portal
The centre has launched a portal for registration and allotment of International Standard Book Number (ISBN).The ISBN portal is a part of central government’s e-governance initiative for streamlining the process of registration for publishers and authors which will make the process user friendly.This initiative is aimed at ensuring ease of registration, enhanced accessibility, wider transparency, trust and credibility and greater efficiency for the book writing fraternity in the country.
- The portal has been created to facilitate publishers and authors to register for ISBN number. ISBN gives an identity to a book without which the bookshops will not sell it.
- The ISBN portal seeks to completely automate the process of seeking application, their examination and allotment of ISBNs. The developed software has several modules including users’ registration and online application submission.
- The automation process also seeks to maintain inventory as well as process the data that will be provided by the users. There will be doing away with receipt of hard copy of any document unless considered appropriate for establishing the identity of the applicant and for confirming the book publishing activity.
ISBN :-
ISBN is a unique number used to identify monographic publications. Displayed in barcode format, ISBN is a 13-character identification allotted by the International ISBN Agency based in Britain through the National ISBN Agency. It provides access to bibliographic data bases used by the book industry and libraries to provide information.
Cabinet approves recommendations of 14th Finance Commissio:-
The Cabinet has approved the 14th Finance Commission’s recommendations on fiscal deficit targets and additional targets for states during 2015-20.
Key details:-
- Fiscal deficit target of 3% for states.
- Besides, the Commission has also provided for year-to-year flexibility for additional deficit. It has provided additional headroom to a maximum of 0.5% over and above the normal limit of 3% in any given year to states that have had a favourable debt-GSDP ratio and interest payments-revenue receipts ratio in the previous two years.
- However, the flexibility in availing the additional fiscal deficit will be available to a state if there is no revenue deficit in the year in which borrowing limits are to be fixed and immediately preceding year.
- Since the year 2015-16 is already over, the States will not get any benefit of additional borrowings for 2015-16. However, the implications for the remaining period of FFC award of 2016-17 to 2019-20, would depend upon respective States’ eligibility based on the criteria prescribed by FFC.
- If a State is not able to fully utilise its sanctioned fiscal deficit of 3% of GSDP in any particular year during the 2016-17 to 2018-19 of FFC award period, it will have the option of availing this un-utilised fiscal deficit amount (calculated in rupees) only in the following year but within FFC award period.
Decoupling Growth from Carbon Emission :-
Throughout the 20th century, the global economy was fuelled by burning coal to run factories and power plants, and burning oil to move planes, trains and automobiles. The more coal and oil countries burned — and the more planet-warming carbon dioxide they emitted — the higher the economic growth.
And so it seemed logical that any policy to reduce emissions would also push countries into economic decline.
Now there are signs that GDP growth and carbon emissions need not rise in tandem, and that the era of decoupling could be starting.
In 2014, for the first time in the 40 years since both metrics have been recorded, global GDP grew but global carbon emissions leveled off. Economists got excited, but they also acknowledged that it could have been an anomalous blip. But a study released by the International Energy Agency last month found that the trend continued in 2015.
Of course, even if 21 countries have achieved decoupling, more than 170 countries have not. They continue to follow the traditional economic path of growth directly tied to carbon pollution. Among those are some of the world’s biggest polluters: China, India, Brazil and Indonesia.
And decoupling by just 21 countries is not enough to save the planet as we know it. The decoupled countries lowered emissions about 1 billion tonnes — but overall global emissions grew about 10 billion tonnes.
The question is whether what happened in the 21 countries can be a model for the rest of the world. Almost all of them are European, but not all are advanced Group of 20 economies. Bulgaria, Romania and Uzbekistan are among them.
The Paris Agreement, the landmark climate change accord reached in December, commits nearly every country to actions to tackle climate change — and to continuously increase the intensity of those actions in the coming decades. But absent major breakthroughs in decoupling, governments are likely to be hesitant to take aggressive steps to curb emissions if they mean economic loss.
In the United States, the decoupling of emissions and economic growth was driven chiefly by the boom in domestic natural gas, which when burned produces about half the carbon pollution of coal. The glut of cheap natural gas drove electric utilities away from coal, while still lighting and powering ever more homes and factories. The decoupling was also driven by improvements in energy-efficiency technology.
But decoupling can hurt. Even as the industrial sector grew overall in those years, a push by U.S. factories to use more energy-efficient technology contributed to a 21 percent loss of industrial jobs.
In smaller economies, decoupling hurts less. Sweden experienced economic growth of 31 percent as its emissions fell 8 percent, continuing a long-standing trend driven by its tax on carbon emissions, instituted in 1991. Today Sweden gets nearly half of its electricity from nuclear power, which produces no emissions, and 35 percent from renewable sources, particularly hydroelectric.
But in large, industrial economies that are trying to decouple, the change raises thorny questions. For example, will the pollution just move elsewhere? In Britain, emissions fell 20 percent between 2000 and 2014, while GDP grew 27 percent. That was largely the result of a push to de-industrialize in the country that gave birth to the Industrial Revolution. As Britain’s financial and service sectors grew and its coal mines, mills and steel factories closed, some of those industries went to China, which became the world’s largest polluter.
China’s GDP has increased 270 per cent since 2000 and its carbon emissions 178 per cent. But there are very tentative signs that even China may be decoupling.
China’s emissions may have peaked in 2014 and have now begun a modest decline. It is hard to know for sure because China’s self-reported emissions data can be faulty. But if it is true, and China’s economy continues on even a modest growth path, it could have profound implications for the future of climate change.
Decoupling presents another problem. “The countries that have achieved decoupling have de-industrialized — and that has increased income inequality,One of the things that has not been analyzed is the job prospects for those families. There’s going to be unintended consequences of their livelihoods being curtailed.
Few Facts :-
- ANM Online application-ANMOL .ANMOL is a tablet-based application that allows ANMs (Auxiliary Nurse Midwife) to enter and updated data for beneficiaries of their jurisdiction.
- E-RaktKosh is an integrated Blood Bank Management Information System that has been conceptualized and developed after multiple consultations with all stakeholders. This web-based mechanism interconnects all the Blood Banks of the State into a single network.
- United Nations Industrial Development Organization in its report has placed India at 6th among the world’s top 10 largest manufacturing countries. China tops the list of 10-top industrial producers followed by the US, Japan, Germany and Korea. Indonesia was at the bottom of the list.
Recent Posts
Steve Ovett, the famous British middle-distance athlete, won the 800-metres gold medal at the Moscow Olympics of 1980. Just a few days later, he was about to win a 5,000-metres race at London’s Crystal Palace. Known for his burst of acceleration on the home stretch, he had supreme confidence in his ability to out-sprint rivals. With the final 100 metres remaining,
[wptelegram-join-channel link=”https://t.me/s/upsctree” text=”Join @upsctree on Telegram”]Ovett waved to the crowd and raised a hand in triumph. But he had celebrated a bit too early. At the finishing line, Ireland’s John Treacy edged past Ovett. For those few moments, Ovett had lost his sense of reality and ignored the possibility of a negative event.
This analogy works well for the India story and our policy failures , including during the ongoing covid pandemic. While we have never been as well prepared or had significant successes in terms of growth stability as Ovett did in his illustrious running career, we tend to celebrate too early. Indeed, we have done so many times before.
It is as if we’re convinced that India is destined for greater heights, come what may, and so we never run through the finish line. Do we and our policymakers suffer from a collective optimism bias, which, as the Nobel Prize winner Daniel Kahneman once wrote, “may well be the most significant of the cognitive biases”? The optimism bias arises from mistaken beliefs which form expectations that are better than the reality. It makes us underestimate chances of a negative outcome and ignore warnings repeatedly.
The Indian economy had a dream run for five years from 2003-04 to 2007-08, with an average annual growth rate of around 9%. Many believed that India was on its way to clocking consistent double-digit growth and comparisons with China were rife. It was conveniently overlooked that this output expansion had come mainly came from a few sectors: automobiles, telecom and business services.
Indians were made to believe that we could sprint without high-quality education, healthcare, infrastructure or banking sectors, which form the backbone of any stable economy. The plan was to build them as we went along, but then in the euphoria of short-term success, it got lost.
India’s exports of goods grew from $20 billion in 1990-91 to over $310 billion in 2019-20. Looking at these absolute figures it would seem as if India has arrived on the world stage. However, India’s share of global trade has moved up only marginally. Even now, the country accounts for less than 2% of the world’s goods exports.
More importantly, hidden behind this performance was the role played by one sector that should have never made it to India’s list of exports—refined petroleum. The share of refined petroleum exports in India’s goods exports increased from 1.4% in 1996-97 to over 18% in 2011-12.
An import-intensive sector with low labour intensity, exports of refined petroleum zoomed because of the then policy regime of a retail price ceiling on petroleum products in the domestic market. While we have done well in the export of services, our share is still less than 4% of world exports.
India seemed to emerge from the 2008 global financial crisis relatively unscathed. But, a temporary demand push had played a role in the revival—the incomes of many households, both rural and urban, had shot up. Fiscal stimulus to the rural economy and implementation of the Sixth Pay Commission scales had led to the salaries of around 20% of organized-sector employees jumping up. We celebrated, but once again, neither did we resolve the crisis brewing elsewhere in India’s banking sector, nor did we improve our capacity for healthcare or quality education.
Employment saw little economy-wide growth in our boom years. Manufacturing jobs, if anything, shrank. But we continued to celebrate. Youth flocked to low-productivity service-sector jobs, such as those in hotels and restaurants, security and other services. The dependence on such jobs on one hand and high-skilled services on the other was bound to make Indian society more unequal.
And then, there is agriculture, an elephant in the room. If and when farm-sector reforms get implemented, celebrations would once again be premature. The vast majority of India’s farmers have small plots of land, and though these farms are at least as productive as larger ones, net absolute incomes from small plots can only be meagre.
A further rise in farm productivity and consequent increase in supply, if not matched by a demand rise, especially with access to export markets, would result in downward pressure on market prices for farm produce and a further decline in the net incomes of small farmers.
We should learn from what John Treacy did right. He didn’t give up, and pushed for the finish line like it was his only chance at winning. Treacy had years of long-distance practice. The same goes for our economy. A long grind is required to build up its base before we can win and celebrate. And Ovett did not blame anyone for his loss. We play the blame game. Everyone else, right from China and the US to ‘greedy corporates’, seems to be responsible for our failures.
We have lowered absolute poverty levels and had technology-based successes like Aadhaar and digital access to public services. But there are no short cuts to good quality and adequate healthcare and education services. We must remain optimistic but stay firmly away from the optimism bias.
In the end, it is not about how we start, but how we finish. The disastrous second wave of covid and our inability to manage it is a ghastly reminder of this fact.
On March 31, the World Economic Forum (WEF) released its annual Gender Gap Report 2021. The Global Gender Gap report is an annual report released by the WEF. The gender gap is the difference between women and men as reflected in social, political, intellectual, cultural, or economic attainments or attitudes. The gap between men and women across health, education, politics, and economics widened for the first time since records began in 2006.
[wptelegram-join-channel link=”https://t.me/s/upsctree” text=”Join @upsctree on Telegram”]No need to remember all the data, only pick out few important ones to use in your answers.
The Global gender gap index aims to measure this gap in four key areas : health, education, economics, and politics. It surveys economies to measure gender disparity by collating and analyzing data that fall under four indices : economic participation and opportunity, educational attainment, health and survival, and political empowerment.
The 2021 Global Gender Gap Index benchmarks 156 countries on their progress towards gender parity. The index aims to serve as a compass to track progress on relative gaps between women and men in health, education, economy, and politics.
Although no country has achieved full gender parity, the top two countries (Iceland and Finland) have closed at least 85% of their gap, and the remaining seven countries (Lithuania, Namibia, New Zealand, Norway, Sweden, Rwanda, and Ireland) have closed at least 80% of their gap. Geographically, the global top 10 continues to be dominated by Nordic countries, with —Iceland, Norway, Finland, and Sweden—in the top five.
The top 10 is completed by one country from Asia Pacific (New Zealand 4th), two Sub-Saharan countries (Namibia, 6th and Rwanda, 7th, one country from Eastern Europe (the new entrant to the top 10, Lithuania, 8th), and another two Western European countries (Ireland, 9th, and Switzerland, 10th, another country in the top-10 for the first time).There is a relatively equitable distribution of available income, resources, and opportunities for men and women in these countries. The tremendous gender gaps are identified primarily in the Middle East, Africa, and South Asia.
Here, we can discuss the overall global gender gap scores across the index’s four main components : Economic Participation and Opportunity, Educational Attainment, Health and Survival, and Political Empowerment.
The indicators of the four main components are
(1) Economic Participation and Opportunity:
o Labour force participation rate,
o wage equality for similar work,
o estimated earned income,
o Legislators, senior officials, and managers,
o Professional and technical workers.
(2) Educational Attainment:
o Literacy rate (%)
o Enrollment in primary education (%)
o Enrollment in secondary education (%)
o Enrollment in tertiary education (%).
(3) Health and Survival:
o Sex ratio at birth (%)
o Healthy life expectancy (years).
(4) Political Empowerment:
o Women in Parliament (%)
o Women in Ministerial positions (%)
o Years with a female head of State (last 50 years)
o The share of tenure years.
The objective is to shed light on which factors are driving the overall average decline in the global gender gap score. The analysis results show that this year’s decline is mainly caused by a reversal in performance on the Political Empowerment gap.
Global Trends and Outcomes:
– Globally, this year, i.e., 2021, the average distance completed to gender parity gap is 68% (This means that the remaining gender gap to close stands at 32%) a step back compared to 2020 (-0.6 percentage points). These figures are mainly driven by a decline in the performance of large countries. On its current trajectory, it will now take 135.6 years to close the gender gap worldwide.
– The gender gap in Political Empowerment remains the largest of the four gaps tracked, with only 22% closed to date, having further widened since the 2020 edition of the report by 2.4 percentage points. Across the 156 countries covered by the index, women represent only 26.1% of some 35,500 Parliament seats and 22.6% of over 3,400 Ministers worldwide. In 81 countries, there has never been a woman head of State as of January 15, 2021. At the current rate of progress, the World Economic Forum estimates that it will take 145.5 years to attain gender parity in politics.
– The gender gap in Economic Participation and Opportunity remains the second-largest of the four key gaps tracked by the index. According to this year’s index results, 58% of this gap has been closed so far. The gap has seen marginal improvement since the 2020 edition of the report, and as a result, we estimate that it will take another 267.6 years to close.
– Gender gaps in Educational Attainment and Health and Survival are nearly closed. In Educational Attainment, 95% of this gender gap has been closed globally, with 37 countries already attaining gender parity. However, the ‘last mile’ of progress is proceeding slowly. The index estimates that it will take another 14.2 years to close this gap on its current trajectory completely.
In Health and Survival, 96% of this gender gap has been closed, registering a marginal decline since last year (not due to COVID-19), and the time to close this gap remains undefined. For both education and health, while progress is higher than economy and politics in the global data, there are important future implications of disruptions due to the pandemic and continued variations in quality across income, geography, race, and ethnicity.
India-Specific Findings:
India had slipped 28 spots to rank 140 out of the 156 countries covered. The pandemic causing a disproportionate impact on women jeopardizes rolling back the little progress made in the last decades-forcing more women to drop off the workforce and leaving them vulnerable to domestic violence.
India’s poor performance on the Global Gender Gap report card hints at a serious wake-up call and learning lessons from the Nordic region for the Government and policy makers.
Within the 156 countries covered, women hold only 26 percent of Parliamentary seats and 22 percent of Ministerial positions. India, in some ways, reflects this widening gap, where the number of Ministers declined from 23.1 percent in 2019 to 9.1 percent in 2021. The number of women in Parliament stands low at 14.4 percent. In India, the gender gap has widened to 62.5 %, down from 66.8% the previous year.
It is mainly due to women’s inadequate representation in politics, technical and leadership roles, a decrease in women’s labor force participation rate, poor healthcare, lagging female to male literacy ratio, and income inequality.
The gap is the widest on the political empowerment dimension, with economic participation and opportunity being next in line. However, the gap on educational attainment and health and survival has been practically bridged.
India is the third-worst performer among South Asian countries, with Pakistan and Afghanistan trailing and Bangladesh being at the top. The report states that the country fared the worst in political empowerment, regressing from 23.9% to 9.1%.
Its ranking on the health and survival dimension is among the five worst performers. The economic participation and opportunity gap saw a decline of 3% compared to 2020, while India’s educational attainment front is in the 114th position.
India has deteriorated to 51st place from 18th place in 2020 on political empowerment. Still, it has slipped to 155th position from 150th position in 2020 on health and survival, 151st place in economic participation and opportunity from 149th place, and 114th place for educational attainment from 112th.
In 2020 reports, among the 153 countries studied, India is the only country where the economic gender gap of 64.6% is larger than the political gender gap of 58.9%. In 2021 report, among the 156 countries, the economic gender gap of India is 67.4%, 3.8% gender gap in education, 6.3% gap in health and survival, and 72.4% gender gap in political empowerment. In health and survival, the gender gap of the sex ratio at birth is above 9.1%, and healthy life expectancy is almost the same.
Discrimination against women has also been reflected in Health and Survival subindex statistics. With 93.7% of this gap closed to date, India ranks among the bottom five countries in this subindex. The wide sex ratio at birth gaps is due to the high incidence of gender-based sex-selective practices. Besides, more than one in four women has faced intimate violence in her lifetime.The gender gap in the literacy rate is above 20.1%.
Yet, gender gaps persist in literacy : one-third of women are illiterate (34.2%) than 17.6% of men. In political empowerment, globally, women in Parliament is at 128th position and gender gap of 83.2%, and 90% gap in a Ministerial position. The gap in wages equality for similar work is above 51.8%. On health and survival, four large countries Pakistan, India, Vietnam, and China, fare poorly, with millions of women there not getting the same access to health as men.
The pandemic has only slowed down in its tracks the progress India was making towards achieving gender parity. The country urgently needs to focus on “health and survival,” which points towards a skewed sex ratio because of the high incidence of gender-based sex-selective practices and women’s economic participation. Women’s labour force participation rate and the share of women in technical roles declined in 2020, reducing the estimated earned income of women, one-fifth of men.
Learning from the Nordic region, noteworthy participation of women in politics, institutions, and public life is the catalyst for transformational change. Women need to be equal participants in the labour force to pioneer the societal changes the world needs in this integral period of transition.
Every effort must be directed towards achieving gender parallelism by facilitating women in leadership and decision-making positions. Social protection programmes should be gender-responsive and account for the differential needs of women and girls. Research and scientific literature also provide unequivocal evidence that countries led by women are dealing with the pandemic more effectively than many others.
Gendered inequality, thereby, is a global concern. India should focus on targeted policies and earmarked public and private investments in care and equalized access. Women are not ready to wait for another century for equality. It’s time India accelerates its efforts and fight for an inclusive, equal, global recovery.
India will not fully develop unless both women and men are equally supported to reach their full potential. There are risks, violations, and vulnerabilities women face just because they are women. Most of these risks are directly linked to women’s economic, political, social, and cultural disadvantages in their daily lives. It becomes acute during crises and disasters.
With the prevalence of gender discrimination, and social norms and practices, women become exposed to the possibility of child marriage, teenage pregnancy, child domestic work, poor education and health, sexual abuse, exploitation, and violence. Many of these manifestations will not change unless women are valued more.
[wptelegram-join-channel link=”https://t.me/s/upsctree” text=”Join @upsctree on Telegram”]2021 WEF Global Gender Gap report, which confirmed its 2016 finding of a decline in worldwide progress towards gender parity.
Over 2.8 billion women are legally restricted from having the same choice of jobs as men. As many as 104 countries still have laws preventing women from working in specific jobs, 59 countries have no laws on sexual harassment in the workplace, and it is astonishing that a handful of countries still allow husbands to legally stop their wives from working.
Globally, women’s participation in the labour force is estimated at 63% (as against 94% of men who participate), but India’s is at a dismal 25% or so currently. Most women are in informal and vulnerable employment—domestic help, agriculture, etc—and are always paid less than men.
Recent reports from Assam suggest that women workers in plantations are paid much less than men and never promoted to supervisory roles. The gender wage gap is about 24% globally, and women have lost far more jobs than men during lockdowns.
The problem of gender disparity is compounded by hurdles put up by governments, society and businesses: unequal access to social security schemes, banking services, education, digital services and so on, even as a glass ceiling has kept leadership roles out of women’s reach.
Yes, many governments and businesses had been working on parity before the pandemic struck. But the global gender gap, defined by differences reflected in the social, political, intellectual, cultural and economic attainments or attitudes of men and women, will not narrow in the near future without all major stakeholders working together on a clear agenda—that of economic growth by inclusion.
The WEF report estimates 135 years to close the gap at our current rate of progress based on four pillars: educational attainment, health, economic participation and political empowerment.
India has slipped from rank 112 to 140 in a single year, confirming how hard women were hit by the pandemic. Pakistan and Afghanistan are the only two Asian countries that fared worse.
Here are a few things we must do:
One, frame policies for equal-opportunity employment. Use technology and artificial intelligence to eliminate biases of gender, caste, etc, and select candidates at all levels on merit. Numerous surveys indicate that women in general have a better chance of landing jobs if their gender is not known to recruiters.
Two, foster a culture of gender sensitivity. Take a review of current policies and move from gender-neutral to gender-sensitive. Encourage and insist on diversity and inclusion at all levels, and promote more women internally to leadership roles. Demolish silos to let women grab potential opportunities in hitherto male-dominant roles. Work-from-home has taught us how efficiently women can manage flex-timings and productivity.
Three, deploy corporate social responsibility (CSR) funds for the education and skilling of women and girls at the bottom of the pyramid. CSR allocations to toilet building, the PM-Cares fund and firms’ own trusts could be re-channelled for this.
Four, get more women into research and development (R&D) roles. A study of over 4,000 companies found that more women in R&D jobs resulted in radical innovation. It appears women score far higher than men in championing change. If you seek growth from affordable products and services for low-income groups, women often have the best ideas.
Five, break barriers to allow progress. Cultural and structural issues must be fixed. Unconscious biases and discrimination are rampant even in highly-esteemed organizations. Establish fair and transparent human resource policies.
Six, get involved in local communities to engage them. As Michael Porter said, it is not possible for businesses to sustain long-term shareholder value without ensuring the welfare of the communities they exist in. It is in the best interest of enterprises to engage with local communities to understand and work towards lowering cultural and other barriers in society. It will also help connect with potential customers, employees and special interest groups driving the gender-equity agenda and achieve better diversity.